CSEd Relative Participation KPI Washington 2023-24
Education administrators, teachers, and advocates should use the following CS Education relative performance KPI (key performance indicators) (KPI) in the dashboards and reports in Washington CS and CTE Education Analytics 2023-24 to compare the state of computer science education in ESDs, districts, and schools in Washington of varying sizes and demographics:
- Gender Relative Participation
- Race Relative Participation
- Income Relative Participation
- ELL (English Language Learner) Relative Participation
- SWD (SWD Relative Participation
Relative Participation KPI are equity measures that show how well CS education is distributed among demographic groups. Just as the Participation Rate metrics allow for comparison of educational organizations with different population sizes, the relative participation KPIs allow for comparison of educational organizations with varying participation rates and student demographics. The dashboards and reports in this blog post track the following relative participation KPI:
Information from the 2024 State of CS Education report (herein 2024 national report) will be used to calculate these relative participation KPI nationally. While the 2025 State of AI and CS Education Report does not provide information to allow us to calculate these relative participation KPI nationally, the 2024 State of CS Education report does.
Calculating the relative KPI nationally vs. Washington results in the following table:
|
|
National |
Washington |
|---|---|---|
|
Gender Relative Participation |
50.6% |
49.2% |
|
Race Relative Participation |
72.7% |
93.1% |
|
Income Relative Participation |
54.4% |
95.6% |
|
ELL Relative Participation |
60.9% |
101.2% |
|
SWD Relative Participation |
63.0% |
85.7% |
100% means that computer science education is evenly distributed between the demographic groups.
Washington does very well compared to national data except for the Gender Relative Participation metric. However, Washington educational organization should only compare themselves to the data using the OSPI CS Education report. The national data from the 2024 report looks only at high school data and has a much narrower definition of a CS course than Washington data. Future analysis of Washington data should look at the extent to which these metrics change between high school and middle school for a better comparison with national data.
While this table allows rough comparisons for Washington educational organizations, the table contains rounding uncertainties that may result in different KPI if numbers from different places in the reports were used. The national data has similar rounding uncertainties. Numbers would be different if detailed raw data were available
Gender Relative Participation
Gender Relative Participation is defined as follows:
The CS Participation Rate for Gender X / Non-Binary students is not included in this calculation.
Gender Relative Participation can also be calculated indirectly as follows:
To calculate national Gender Relative Participation, page 67 of the 2024 national report provides the following chart showing what percentage of CS students were male, female, or non-binary
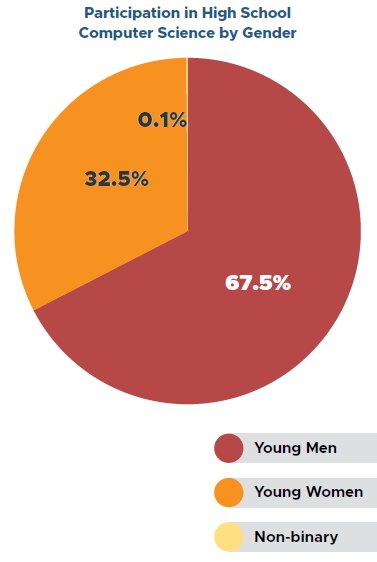
To calculate the national Gender Relative Participation Rate using this data, we also need to know the percentage of students nationally who were boys/girls/non-binary. While the 2024 national report does not provide this data, it is available from calculations on NCES CCD data files: 48.7% girls, 51.2% boys, 0.1% unspecified.
This provides national Gender Relative Participation for 2023-24 at
To calculate this data for Washington, we look at the Gender tab of the CS Education in Washington Demographic Drilldown 2019-24 dashboard and look up the CS Participation Rate for girls (5.8%) and the CS Participation Rate for boys (11.8%) for SY 2023-24
This provides the Washington Gender Relative Participation for 2023-24 at
Race Relative Participation
Race Relative Participation is defined as follows:
In the above equation:
- Group A consists of Black/African American, Hispanic/LatinX, Hawaiian/Pacific Islander, and Native American students,
- Group B consists of White and Asian students
- Two-or-more and Not Provided/Other students are not included in this calculation
Race Relative Participation can also be calculated as follows
Race Relative Participation = (% CS students who are in Group A / % all students who are in Group A) / (% CS Students who are in Group B / % of all students who are in Group B)
To calculate the national Rate Relative Participation, page 60 of the 2024 national report contains the following chart:
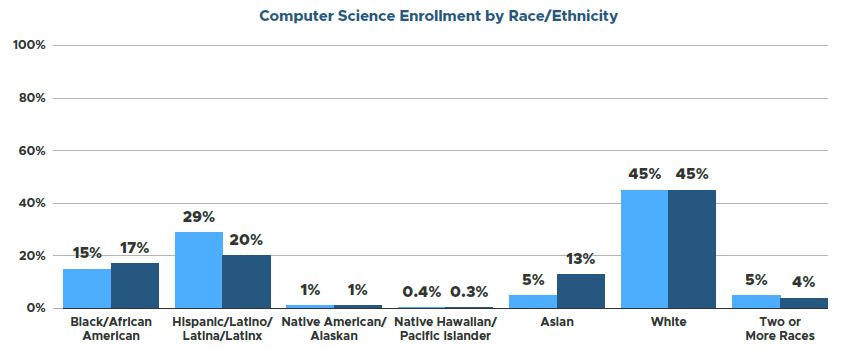
Using this chart and the alternate calculation method, the national Race Relative Participation Rate is:
((17 + 20 + 1 + 0.3)/ (15 + 29 + 1 + 0.4)) /((13 + 45)/(5 + 45)) = 72.7%
To calculate this data for Washington, we look at the Race/Ethnicity tab of CS Education in Washington Demographic Drilldown 2019-24 to create the following table of race/ethnicity student population percentages and CS participation rates:
|
|
% Student Population |
CS Participation Rate |
|---|---|---|
|
Black/African American |
4.5% |
8.8% |
|
Hispanic/LatinX |
24.8% |
8.4% |
|
Hawaiian/Pacific Islander |
1.3% |
9.0% |
|
Native American/Eskimo |
1.3% |
7.2% |
|
White |
49.2% |
8.0% |
|
Asian |
7.9% |
15.6% |
Using this table, the Washington Race Relative Participation Rate for SY2023-24 is:
Income Relative Participation
Income Relative Participation is defined as follows:
The terms “low-income” and “free-and-reduced lunch (FRL)” or “economically disadvantaged” are considered to represent the same demographic in these studies.
Income Relative Participation can also be calculated as follows
Page 62 of the 2024 national report provides the following chart:
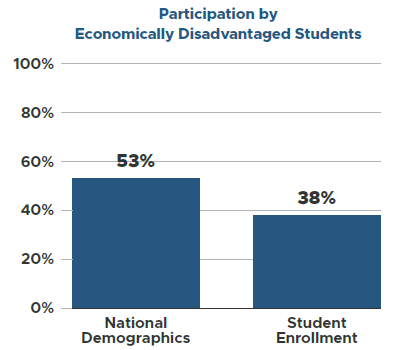
Using this chart and the alternate calculation method, the national Income Relative Participation Rate is
To calculate this data for Washington, we look at the Income tab of CS Education in Washington Demographic Drilldown 2019-24 and look up the CS Participation Rate for Low-Income Students (8.6%) and the CS Participation Rate for Non-Low-Income Students (9.0%) for SY 2023-24
This provides the Washington Income Relative Participation for 2023-24 at
ELL Relative Participation
ELL (English Language Learner) Relative Participation is defined as follows:
ELL Relative Participation can also be calculated as follows:
Page 63 of the 2024 national report provides the following chart:
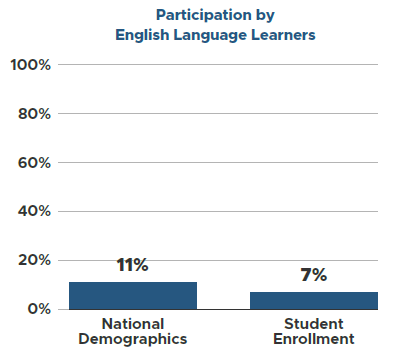
Using this chart and the alternate calculation method, the national ELL Participation Rate is
For Washington, the ELL tab of CS Education in Washington Demographic Drilldown 2019-24 has the CS Participation Rate for ELL Students (9.0%) and the CS Participation Rate for Non-Low Income Students (8.9%) for SY 2023-24.
This provides the Washington Income Relative Participation for 2023-24 at:
SWD Relative Participation
SWD (Students With Disabilities) Relative Participation is defined as follows:
SWD Relative Participation can also be calculated as follows:
Students with Disabilities are those students with IEPs. The OSPI 2023-24 K–12 Computer Science Education Data Summary Report does not provide data on Students with 504 Plans.
Page 64 of the 2024 national report provides the following chart:
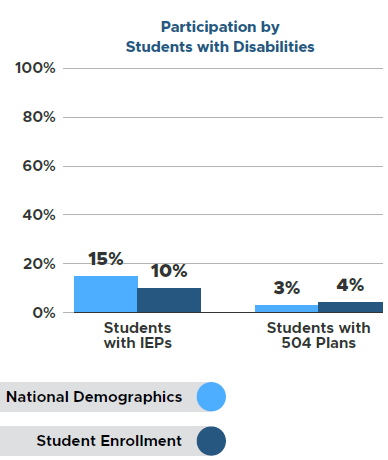
Using this chart and the alternate calculation method, the national SWD Participation Rate is
For Washington, the SWD tab of CS Education in Washington Demographic Drilldown 2019-24 has the CS Participation Rate for SWD (7.8%) and the CS Participation Rate for Non-SWD (9.1%) for SY 2023-24
This provides the Washington SWD Relative Participation for 2023-24 at:
Related Posts
To see the descriptions and calculations for other KPI listed in KPI for CS Education in Washington 2023-24, see the following posts:
- CSEd Availability KPI Washington 2023-24 (CS Available School Percentage, CS Available Student Percentage)
- CSEd Participation KPI Washington 2023-24 (CS Participation Rate, CS Participation Rate for Students with Access)