
CSEd Participation KPI Washington 2023-24
Education administrators, teachers, and advocates should use the following two CS Education participation key performance indicators (KPI) in the dashboards and reports in Washington CS and CTE Education Analytics 2023-24 to compare the state of computer science education in ESDs, districts, and schools in Washington of varying sizes and demographics:
- CS Participation Rate
- CS Participation Rate for Students with Access
These KPI measure the percentage of students who enrolled in a computer science course during the school year. They allow comparison of the enrollment in CS courses among schools, districts, ESDs, and states that may have different sizes.
The CS Student Participation for Students with Access metric looks at the percentage of students enrolled in CS only in schools that have an active CS course. CS Student Participation for Students with Access is the most appropriate metric to use to benchmark the results of an individual school.
CS Participation Rate
On page 56 of the 2025 State of AI and CS Education report (herein 2025 national report), Washington significantly trails national averages in CS Participation Rate
|
National |
Washington |
|---|---|
|
6.1% |
4.5% |
The following chart from the Overall Enrollment tab on the CS Education in Washington Demographic Drilldown 2019-24 dashboard shows the CS Student Participation Rate for 2023-24 was 8.6%. The data for this dashboard came from 2023-24 K–12 Computer Science Education Data Summary Report published by OSPI in the summer of 2025.
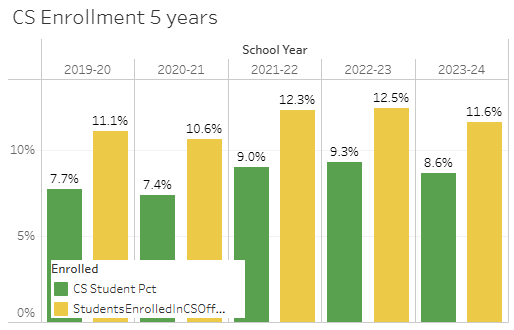
School administrators, teachers, and advocates in Washington should use 8.6% as the baseline CS Participation Rate for comparing your own ESD or district data.
The 8.6% from OSPI data is much different from the 4.5% in the 2025 report. The 2025 national report uses only high school data, has a much narrower definition of a CS course, and may differ in timing from the OSPI report.
CS Participation Rate for Students with Access
The chart also shows CS Participation Rate for Students with Access at 11.6%. This rate shows what percentage of students were enrolled in a CS course given that they were in a school that offered CS in the first place. 11.6% is therefore the CS Participation Rate for individual schools to target. The 2025 national report and its predecessors do not provide a metric similar to CS Participation Rate for Students with Access.
One important finding from the OSPI report is that both the overall CS Participation Rate and the CS Participation Rate for Students with Access decreased from SY2022-23 to SY2023-24, after several years of increases.
Related Posts
To see the descriptions and calculations for other KPI listed in KPI for CS Education in Washington 2023-24, see the following posts:
- CSEd Availability KPI Washington 2023-24 (CS Available School Percentage, CS Available Student Percentage)
- CSEd Relative Participation KPI Washington 2023-24 (Gender Relative Participation, Race Relative Participation, Income Relative Participation, ELL Relative Participation, SWD Relative Participation)