
Demo: Washington CS Teacher Population 2019-24
The two Tableau visualizations CS Teachers in Washington 2019-24 and CS Teacher Demographics in Washington 2019-24 illustrate the changes in the distribution of educators teaching CS courses in Washington’s public schools from 2019 to 2024.
CS Teachers in Washington 2019-24

This visualization can also be found on Tableau Public.
CS Teachers in Washington 2019-24 illustrates how the number of CS teachers, total students per CS teacher, and CS students per CS teacher changed from 2019 through 2024. Drilldowns are available statewide, per ESD, and per school.
CS Teacher Demographics in Washington 2019-24
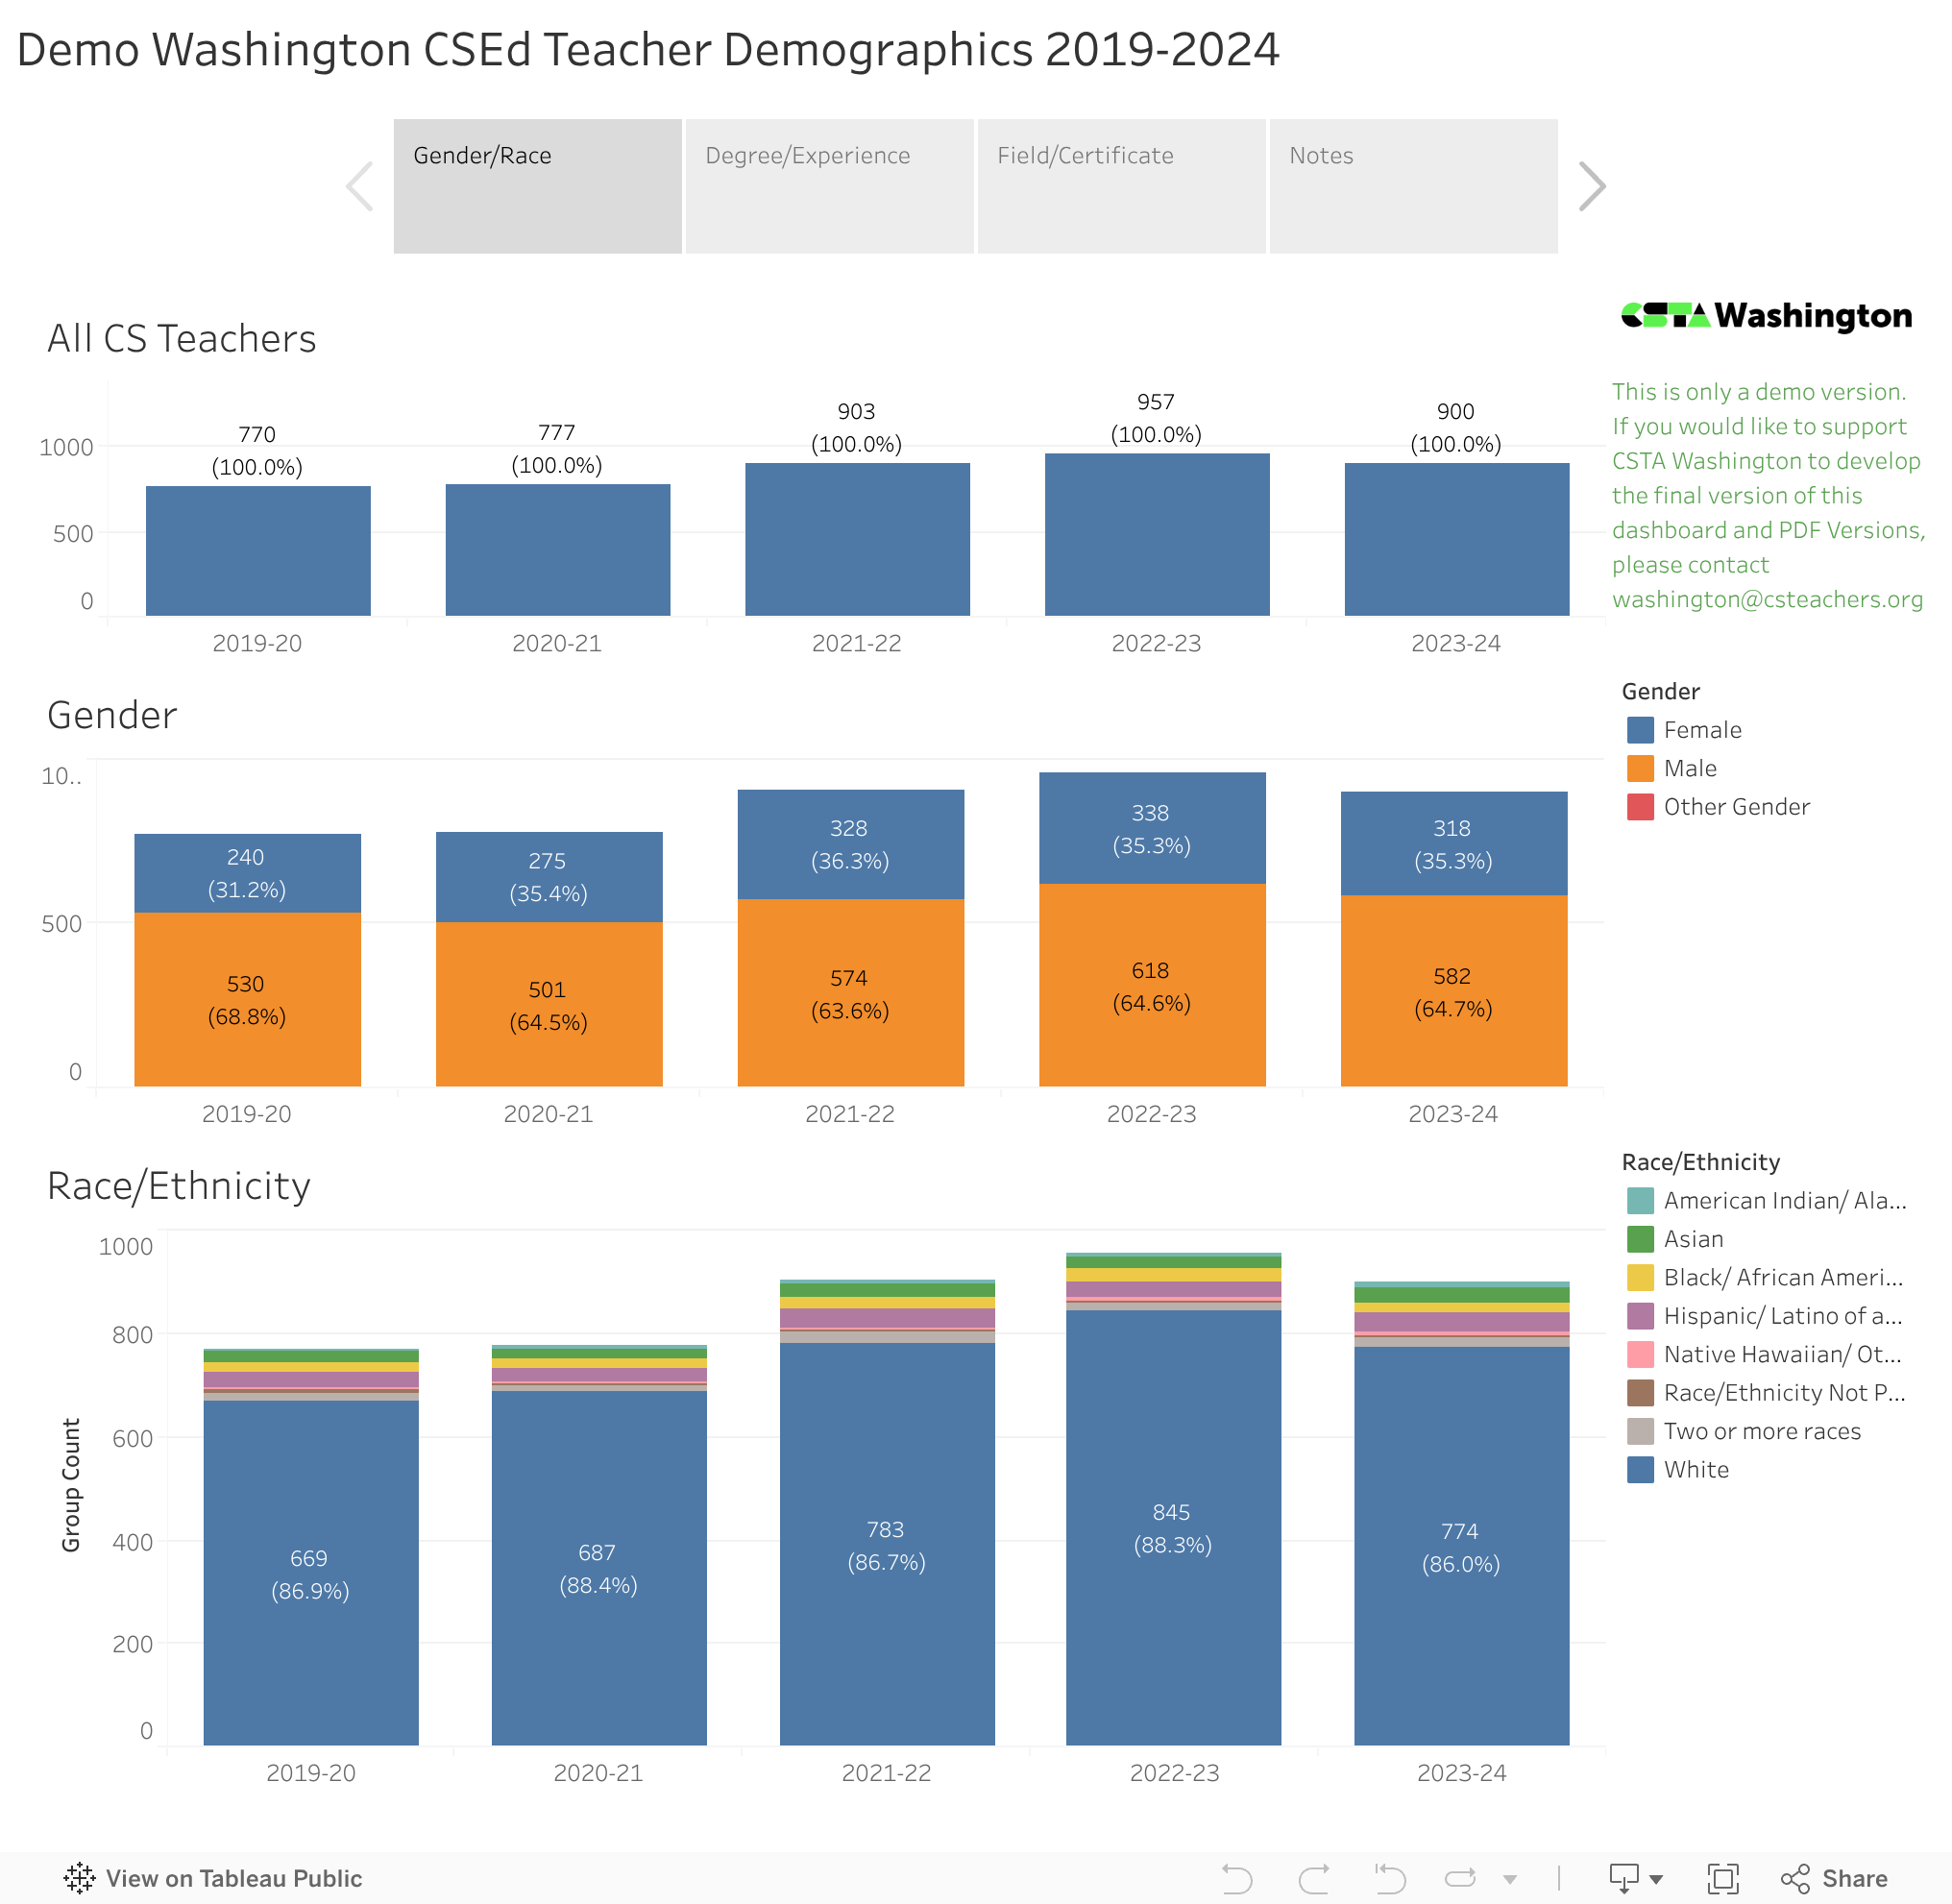
This visualization can also be found on Tableau Public
CS Teachers in Washington 2019-24 illustrates how the number of CS teachers, total students per CS teacher, and CS students per CS teacher changed from 2019 through 2024. Drilldowns are available statewide, per ESD, and per school.
These two visualizations are based on the Teachers_State and the Teachers_School (integrated with info from Students_School) tabs of the 2023-24 K–12 Computer Science Education Data Summary Report released by OSPI in June 2025.
With this and related visualizations and report PDFs, it is hoped that educational leaders at the state, ESD, district, and school level can better understand the strengths and weaknesses and make better decisons regarding CS and CTE education in their organizations. For a full list of all related visualizations and PDFs currently available, please visit Washington CS and CTE Education Analytics 2025.
The data presented in these Tableau visualization is complete and accurate to the best of our knowledge. However, these visualizations are not final and should be considered demonstration versions for feedback. If you have any feedback or would like to sponsor further development of these and other Tableau visualizations and PDF reports on CTE and CS Education in Washington, please contact us at washington@csteachers.org