Top Schools and Districts for CSEd 2023-24
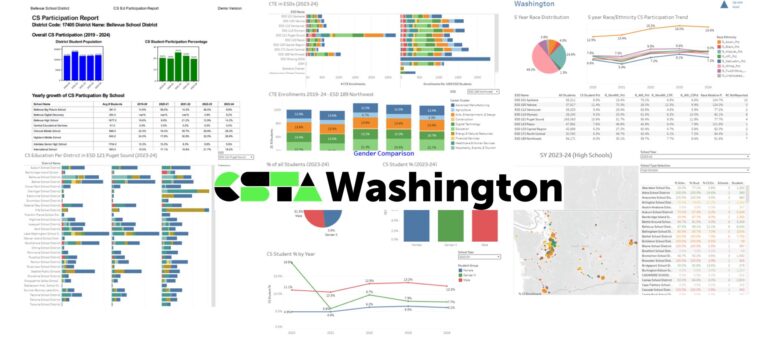
The dashboards in Washington CS Education Enrollments 2019-24 and CS Education in Washington Demographic Drilldown 2019-24 that are based on the 2023-24 K–12 Computer Science Education Data Summary Report published by OSPI in June 2025 provide data on what percentage of students are enrolled in CS in a particular school, district, or ESD. While these dashboards make it easy to retrieve information on a particular entity, it is not necessarily easy to identify the schools and districts in Washington with the highest CS Education participation rates. This post identifies the schools and districts with the highest (and lowest) CS education participation rates.
The top districts and schools for CSEd in Washington for 2023-24 (CS Participation Rate in parentheses) are:
- District: Wahluke School District (37.1%)
- High School: Nikola Tesla STEM High School (61.9%)
- Middle School: Wahluke Junior High (87.8%)
- Small School: Rooted School Washington (100%), Washington Youth ChalleNGe Academy (100%)
Top 12 lists for each of the above categories, Bottom 12 lists, and Notes follow.
Top Schools and Districts for CSEd 2023-24
Top Districts
The following are the top 12 school districts for CSEd in Washington in 2023-24, ranked by their CS Participation Rate (% of students enrolled in a CS Course). A district must have at least 500 students to qualify.
|
District |
ESD |
Total Students |
Low-income percentage |
CS Participation Rate |
|---|---|---|---|---|
|
Wahluke School District |
ESD 105 Yakima |
1458 |
59.1% |
37.1% |
|
Toledo School District |
ESD 133 Capital Region |
503 |
41.2% |
32.4% |
|
Dieringer School District |
ESD 121 Puget Sound |
516 |
23.8% |
31.0% |
|
Grandview School District |
ESD 105 Yakima |
2127 |
88.7% |
27.4% |
|
Fife School District |
ESD 121 Puget Sound |
2151 |
52.8% |
21.5% |
|
North Franklin School District |
ESD 123 Pasco |
1183 |
75.3% |
21.0% |
|
Bethel School District |
ESD 121 Puget Sound |
12682 |
51.5% |
20.6% |
|
Bellevue School District |
ESD 121 Puget Sound |
12147 |
24.0% |
19.3% |
|
Oak Harbor School District |
ESD 189 Northwest |
3142 |
41.8% |
19.1% |
|
Goldendale School District |
ESD 105 Yakima |
547 |
70.9% |
19.0% |
|
Othello School District |
ESD 123 Pasco |
2637 |
80.7% |
17.5% |
|
Granite Falls School District |
ESD 189 Northwest |
1415 |
47.0% |
17.0% |
Top High Schools
The following are the top 12 high schools for CSEd in Washington in 2023-24, ranked by their CS Participation Rate (% of students enrolled in a CS Course). A high school must have at least 500 students to qualify.
|
School |
District |
Total Students |
Low-income percentage |
CS Participation Rate |
|---|---|---|---|---|
|
Nikola Tesla STEM High School |
Lake Washington School District |
603 |
2.5% |
61.9% |
|
Vancouver iTech Preparatory |
Vancouver School District |
593 |
32.0% |
42.7% |
|
Washington Network for Innovative Careers Skill Center |
Lake Washington School District |
799 |
2.6% |
35.2% |
|
Technology Access Foundation Academy at Saghalie |
Federal Way School District |
575 |
75.5% |
33.7% |
|
Grandview High School |
Grandview School District |
1211 |
87.4% |
31.2% |
|
Cleveland High School STEM |
Seattle Public Schools |
829 |
52.7% |
30.9% |
|
North Creek High School |
Northshore School District |
1930 |
18.5% |
27.6% |
|
Science and Math Institute |
Tacoma School District |
799 |
28.9% |
26.3% |
|
Charles Francis Adams High School |
Clarkston School District |
722 |
43.6% |
26.2% |
|
On Track Academy |
Spokane School District |
672 |
59.2% |
25.3% |
|
Mount Vernon High School |
Mount Vernon School District |
2059 |
64.7% |
24.4% |
|
Prosser High School |
Prosser School District |
897 |
79.3% |
24.2% |
Top Middle Schools
The following are the top 12 middle schools for CSEd in Washington in 2023-24, ranked by their CS Participation Rate (% of students enrolled in a CS Course). A middle school must have at least 500 students to qualify.
|
School |
District |
Total Students |
Low-income percentage |
CS Participation Rate |
|---|---|---|---|---|
|
Wahluke Junior High |
Wahluke School District |
616 |
82.1% |
87.8% |
|
Frontier Middle School |
Bethel School District |
660 |
46.7% |
60.3% |
|
Liberty Middle School |
Bethel School District |
972 |
56.0% |
49.0% |
|
Bethel Middle School |
Bethel School District |
734 |
58.2% |
45.1% |
|
Vancouver iTech Preparatory |
Vancouver School District |
593 |
32.0% |
42.7% |
|
North Pines Middle School |
Central Valley School District |
587 |
78.5% |
40.4% |
|
Tyee Middle School |
Bellevue School District |
960 |
17.7% |
40.2% |
|
Cedarcrest Middle School |
Bethel School District |
768 |
62.5% |
38.4% |
|
Odle Middle School |
Bellevue School District |
976 |
19.7% |
37.9% |
|
Spanaway Middle School |
Bethel School District |
828 |
67.3% |
37.8% |
|
Stevens Middle School |
Port Angeles School District |
503 |
58.6% |
34.2% |
|
Technology Access Foundation Academy at Saghalie |
Federal Way School District |
575 |
75.5% |
33.7% |
Top Small Schools
The following are the top 12 small schools (<= 500 students) for CSEd in Washington in 2023-24, ranked by their CS Participation Rate (% of students enrolled in a CS Course). The school must have at least one grade between 6 to 12 to qualify.
|
School |
District |
Total Students |
Low-income percentage |
CS Participation Rate |
|---|---|---|---|---|
|
Rooted School Washington |
Rooted School Vancouver |
30 |
63.3% |
100.0% |
|
Washington Youth ChalleNGe Academy |
Washington Military Department |
327 |
0.0% |
100.0% |
|
Pasco Innovative Experiences and e-Learning |
Pasco School District |
99 |
57.6% |
99.0% |
|
Green Mountain School |
Green Mountain School District |
51 |
37.3% |
96.1% |
|
Ignite Family Academy |
North Thurston Public Schools |
29 |
34.5% |
72.4% |
|
West Valley Innovation Center |
West Valley School District (Yakima) |
188 |
58.5% |
68.6% |
|
Toledo Middle School |
Toledo School District |
187 |
42.2% |
64.7% |
|
Pacific Crest Innovation Academy |
Mill A School District |
27 |
33.3% |
59.3% |
|
Cedar High School |
Shelton School District |
93 |
53.8% |
58.1% |
|
Lincoln High School |
Walla Walla Public Schools |
257 |
80.2% |
51.8% |
|
Granite Falls Middle School |
Granite Falls School District |
479 |
52.2% |
44.9% |
|
Colton School |
Colton School District |
62 |
33.9% |
43.5% |
Bottom Schools and Districts for CSEd 2023-24
Bottom Districts
The following are the 12 largest school districts that did not have any students enrolled in a CS course in 2023-24.
|
District |
ESD |
Total Students |
Low-income percentage |
CS Participation Rate |
|---|---|---|---|---|
|
Burlington-Edison School District |
ESD 189 Northwest |
1978 |
56.5% |
0.0% |
|
Washougal School District |
ESD 112 Vancouver |
1636 |
37.8% |
0.0% |
|
Deer Park School District |
ESD 101 Spokane |
1591 |
48.5% |
0.0% |
|
Meridian School District |
ESD 189 Northwest |
956 |
27.2% |
0.0% |
|
Kettle Falls School District |
ESD 101 Spokane |
929 |
45.0% |
0.0% |
|
CASHMERE SCHOOL DISTRICT |
ESD 171 North Central |
900 |
48.4% |
0.0% |
|
Starbuck School District |
ESD 123 Pasco |
897 |
7.2% |
0.0% |
|
Castle Rock School District |
ESD 112 Vancouver |
820 |
49.9% |
0.0% |
|
Kiona-Benton City School District |
ESD 123 Pasco |
814 |
61.3% |
0.0% |
|
Montesano School District |
ESD 133 Capital Region |
813 |
38.7% |
0.0% |
|
South Whidbey School District |
ESD 189 Northwest |
755 |
31.5% |
0.0% |
|
Newport School District |
ESD 101 Spokane |
667 |
58.0% |
0.0% |
Bottom High Schools
The following are the 12 largest high schools that did not have any students enrolled in a CS course in 2023-24.
|
School |
District |
Total Students |
Low-income Percentage |
CS Participation Rate |
|---|---|---|---|---|
|
Auburn Senior High School |
Auburn School District |
2069 |
58.0% |
0.0% |
|
Ray Reynolds Middle School |
Pasco School District |
1371 |
51.2% |
0.0% |
|
White River High School |
White River School District |
1343 |
31.7% |
0.0% |
|
Dr. Dolores Silas High School |
Tacoma School District |
1173 |
43.5% |
0.0% |
|
Burlington Edison High School |
Burlington-Edison School District |
1159 |
52.5% |
0.0% |
|
Mark Morris High School |
Longview School District |
1149 |
41.8% |
0.0% |
|
Edmonds eLearning Academy |
Edmonds School District |
1141 |
10.7% |
0.0% |
|
Washougal High School |
Washougal School District |
937 |
39.3% |
0.0% |
|
Virtual Preparatory Academy of Washington |
Starbuck School District |
892 |
7.2% |
0.0% |
|
Tacoma School of the Arts |
Tacoma School District |
861 |
41.1% |
0.0% |
|
West Valley High School |
West Valley School District (Spokane) |
821 |
48.8% |
0.0% |
|
Vancouver School of Arts and Academics |
Vancouver School District |
796 |
28.0% |
0.0% |
Bottom Middle Schools
The following are the 12 largest middle schools that did not have any students enrolled in a CS course in 2023-24.
|
School |
District |
Total Students |
Low-income Percentage |
CS Participation Rate |
|---|---|---|---|---|
|
Washington Virtual Academy Omak Middle School |
Omak School District |
1538 |
49.7% |
0.0% |
|
Ray Reynolds Middle School |
Pasco School District |
1371 |
51.2% |
0.0% |
|
Mcloughlin Middle School |
Pasco School District |
1187 |
58.7% |
0.0% |
|
Edmonds eLearning Academy |
Edmonds School District |
1141 |
10.7% |
0.0% |
|
Eckstein Middle School |
Seattle Public Schools |
1067 |
14.6% |
0.0% |
|
Madison Middle School |
Seattle Public Schools |
1048 |
16.1% |
0.0% |
|
Mcloughlin Middle School |
Vancouver School District |
987 |
61.1% |
0.0% |
|
Chinook Middle School |
Kennewick School District |
977 |
50.1% |
0.0% |
|
Nelsen Middle School |
Renton School District |
968 |
54.0% |
0.0% |
|
Islander Middle School |
Mercer Island School District |
963 |
7.3% |
0.0% |
|
Desert Hills Middle School |
Kennewick School District |
938 |
27.1% |
0.0% |
|
Horse Heaven Hills Middle School |
Kennewick School District |
935 |
54.4% |
0.0% |
Notes
- The 2025 State of AI and CS Education Report and its predecessors provide nationwide data that small schools (<=500 students) are significantly less likely to offer computer science courses. Washington shows similar data. This report breaks out schools with < 500 students into a separate category to reflect their different circumstances.
- Lack of funding is a concern for schools/districts to provide computer science classes. The percentage of low-income students in a school/district is listed in the above tables to provide insight into this issue.
- “High School” refers to schools with two grades between 9-12, at least one of which is 11th or 12th grade.
- “MIddle schools” refers to schools with two grades between 6 – 8 at least one which is 7th or 8th grade.
- “High School” results include schools that are both “High Schools” and “Middle Schools” (e.g., a 7 – 12 school). All student enrollment data from schools that were both “High School” and “Middle School” were included in the data displayed, regardless of student grade. Similarly, “Middle School” results include schools that are both “High Schools” and “Middle Schools” (e.g., a 7-12 school).