Washington CSEd Students and Teachers 2026 Beta
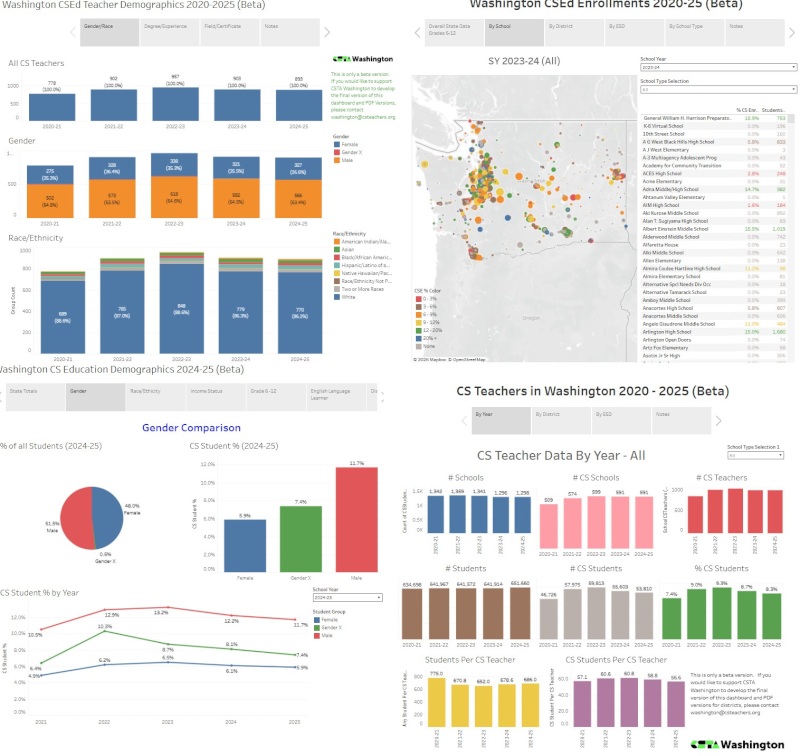
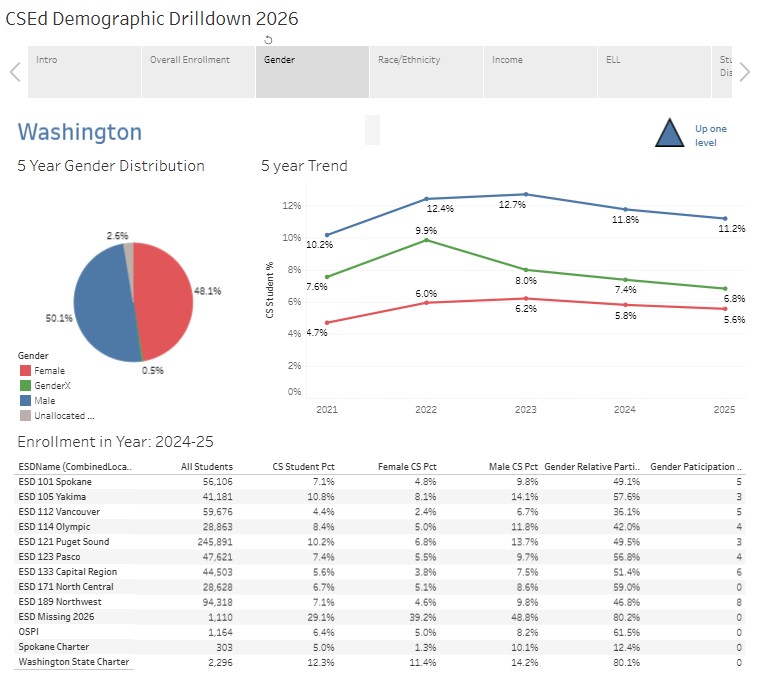
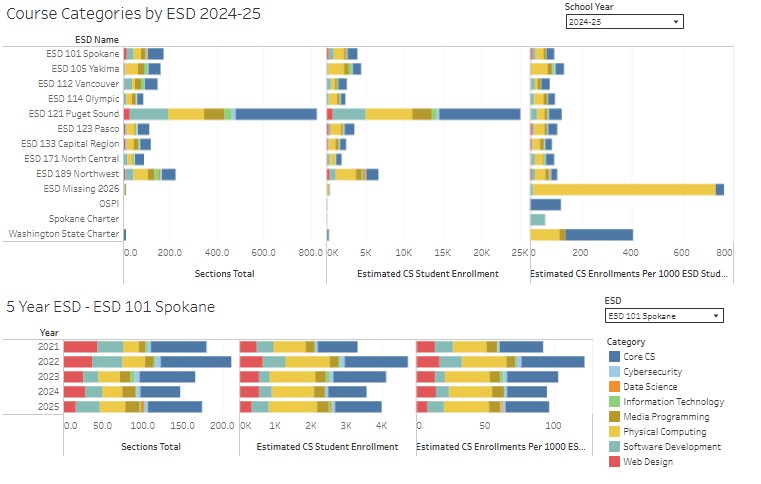
This Tableau visualization explores computer science student enrollments and the computer science teacher population for grades 6 – 12 in Washington for SY 2020-21 to SY 2024-25. This dashboard primarily uses data from the Computer Science Education Data Summary Report, which OSPI publishes yearly under HB 1577 (2019). The current version released in June 2026 school years 2020-21 through 2024-25.
View on Tableau Public (recommended)

This dashboard consists of four Tableau stories that were previously separate dashboards in previous years:
- CSEd Student Enrollments
- CSEd Student Demographics
- CSEd Teacher Population
- CSEd Teacher Demographics
While this dashboard is feature- and data- complete to the best of our knowledge, it is a beta version as of 8/15/2026. CSTA Washington wants your feedback on how these can be improved for the final 2026 version and for future-year versions. CSTA Washington is also seeking sponsors to help fund development of the final 2026 versions and future-year versions. If you would like to provide feedback on these beta versions or would like to sponsor (or donate to) the development of future versions, please contact washington@csteachers.org.
CSEd Student Enrollments
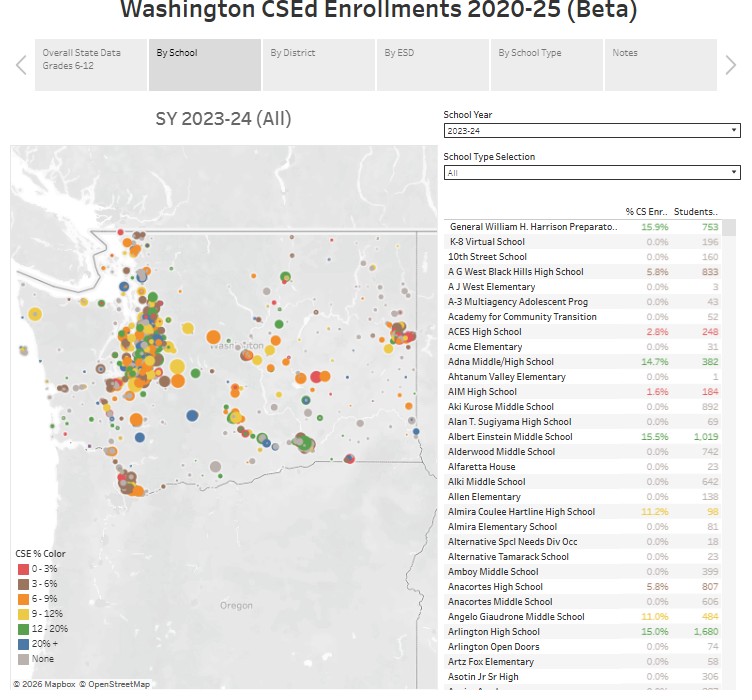
The CSEd Student Demographics story provides map visualizations and data grid showing the percentage of schools offering CS, the percentage of students offered CS, and the percentage of students enrolled in CS from 2020 to 2024. Drilldowns into this data are available statewide, by ESD, by school district, by school, and by school type. This story is primarily based on the Student_School tab of the 2024-25 K-12 Computer Science Education Data Summary Report released by OSPI in June 2026.
CSEd Student Demographics
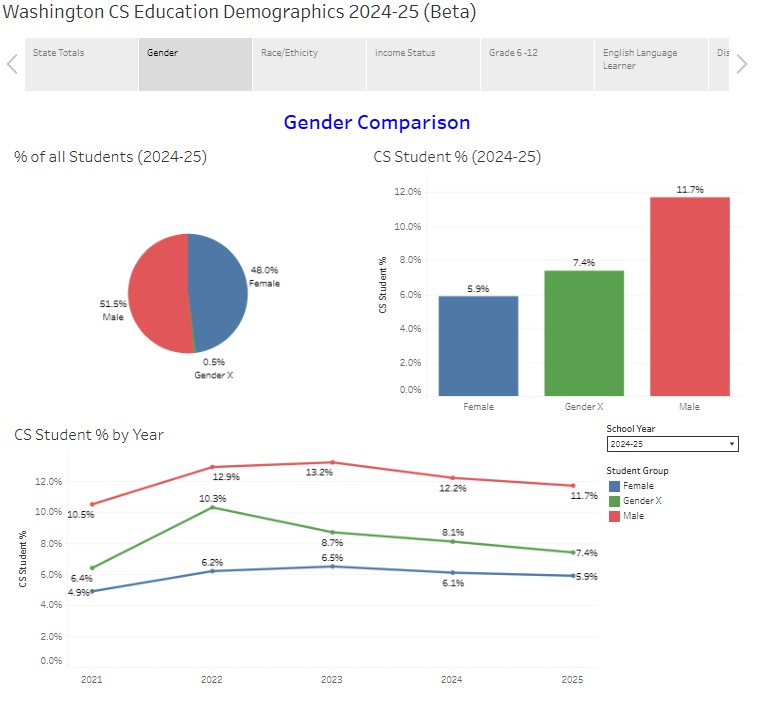
The CSEd Student Demographics story provides visualizations of how the percentage of students enrolled in CS changed statewide in various demographic groups from 2020-25. Drilldowns into this data are available by gender, by race/ethnicity, by income, by grade level, by English Language Learner status, and by disability status. This story is based on the Student_State tab of the 2024-25 K-12 Computer Science Education Data Summary Report released by OSPI in June 2026.
CSEd Teacher Population
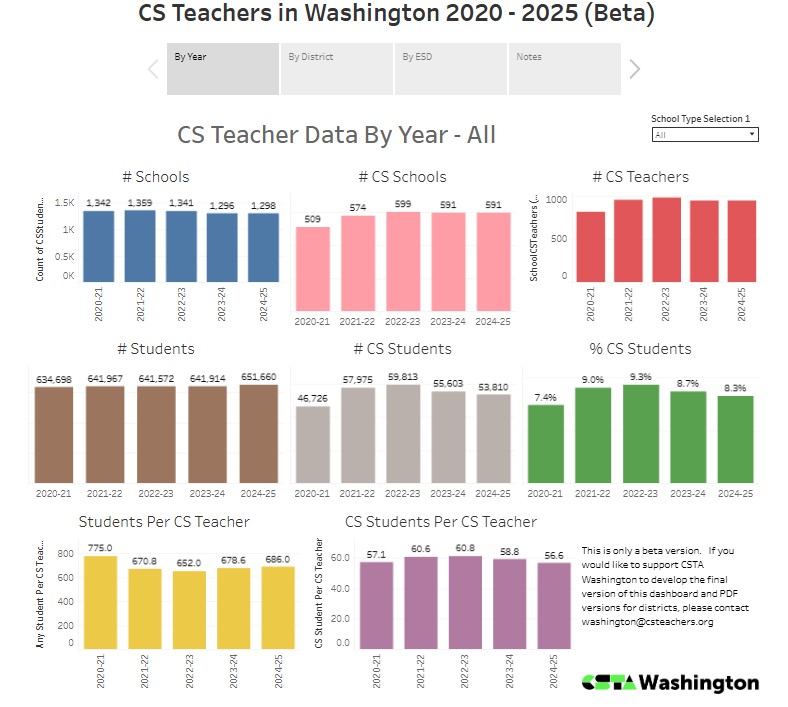
The CSEd Teacher population story shows how the number of CS teachers, total students per CS teacher, and CS students per CS teacher changed from 2020 through 2025, using both map visualizations and grid tables. Drilldowns are available statewide, per ESD, and per school. This story is primarily based on the Teachers_School (with data integrated from Student_School) tab of the 2024-25 K-12 Computer Science Education Data Summary Report released by OSPI in June 2026.
CSEd Teacher Demographics
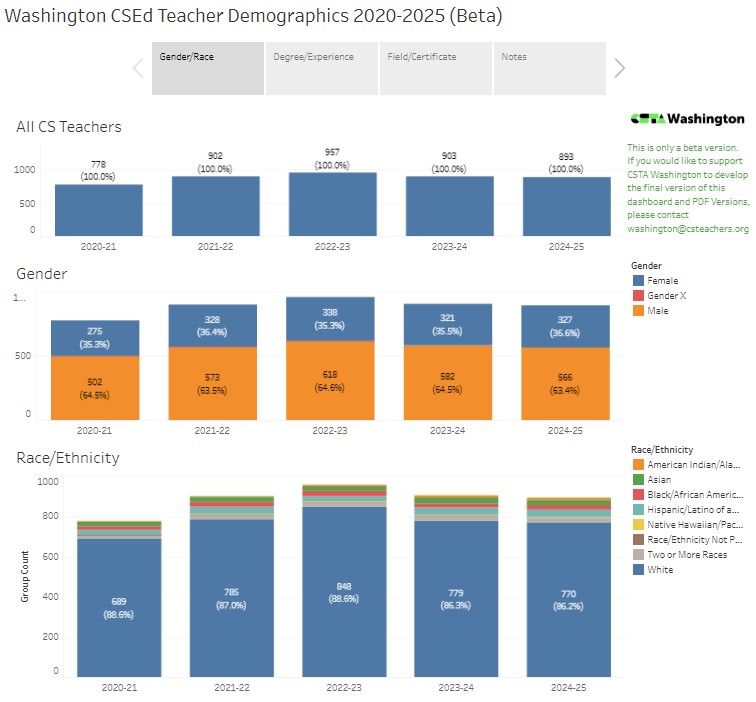
The CSEd Teacher Demographics story shows how the demographics of CS teachers in Washington changed from 2010=2025. Breakdowns are available by gender, by race/ethnicity, by degree/experience, and by certification/in field status. This story is based on the Teachers_State tab of the 2024-25 K-12 Computer Science Education Data Summary Report released by OSPI in June 2026.