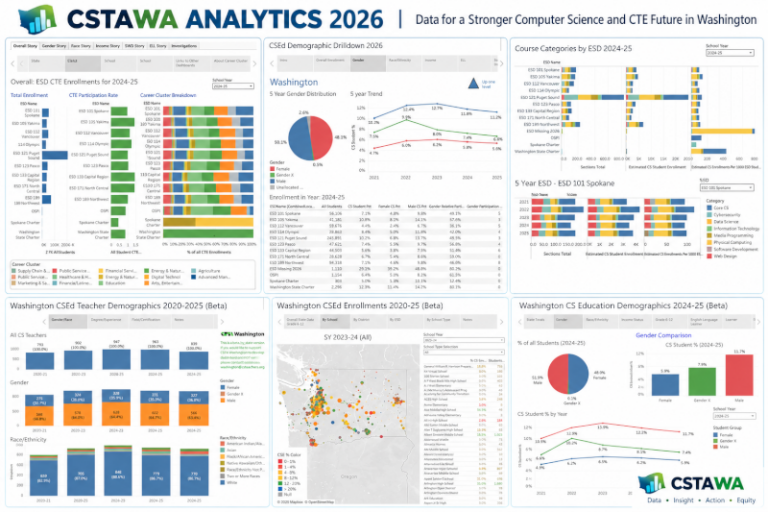
Washington CSEd Demographic Drilldown 2026 Beta
Using this Tableau visualization, one can view how CS enrollment overall, by gender, by race/ethnicity, by income level, by ELL status, by disability status, and by grade level changed statewide, per ESD, per district, and per school from SY2020-21 to SY2024-25.
View this visualization on Tableau Public (recommended)

This dashboard explores CS education growth and distribution in Washington from the perspective of overall CS enrollments, gender, race/ethnicity, income, ELL status, disabiliity status, and grade level. Further, one can drill down to see details for all the districts in an ESD or all the schools in a district by clicking on the grids in the dashboard. Click on the blue triangle in the top right corner to scope back up. With this visualization, one can better understand how computer science education has grown through Washington’s public schools during the five school years from 2019-2024.
The primary data source for this dashboard is the Student_School tab of the 2024-25 K–12 Computer Science Education Data Summary Report that was published by OSPI in late June 2026. Substantial work was done to make reasonable estimates or other workarounds for data on demographic groups that were suppressed in the original OSPI report.
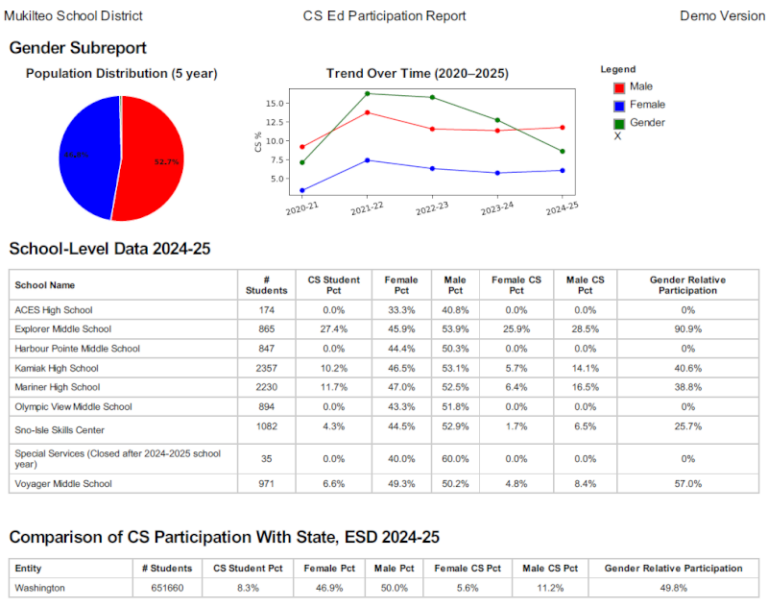
With these and related visualizations and report PDFs, educational leaders at the state, ESD, district, and school levels can better understand the strengths and weaknesses and make better decisions about CS and CTE education in their organizations.
The data presented in this Tableau visualization is complete and accurate to the best of our knowledge. However, this visualization is not final and should be considered a beta version for feedback. If you have any feedback or would like to sponsor further development of this and other Tableau visualizations and PDF reports on CTE and CS Education in Washington, please contact us at washington@csteachers.org.