Washington CSEd Regional Differences in Participation 2026
The Data
The blog post Washington CSEd Availability and Participation KPI 2026 reported a significant decrease in the percentage of students enrolled in computer science courses in Washington. The percentage of Washington students in grades 6-12 who were enrolled in CS courses declined from 9.3% in 2022-23 to 8.3% in 2024-25, a 10.8% drop in two years. Most of this decline in participation was due to declining student enrollments even in schools that offered CS, a -10.4% drop over two years.
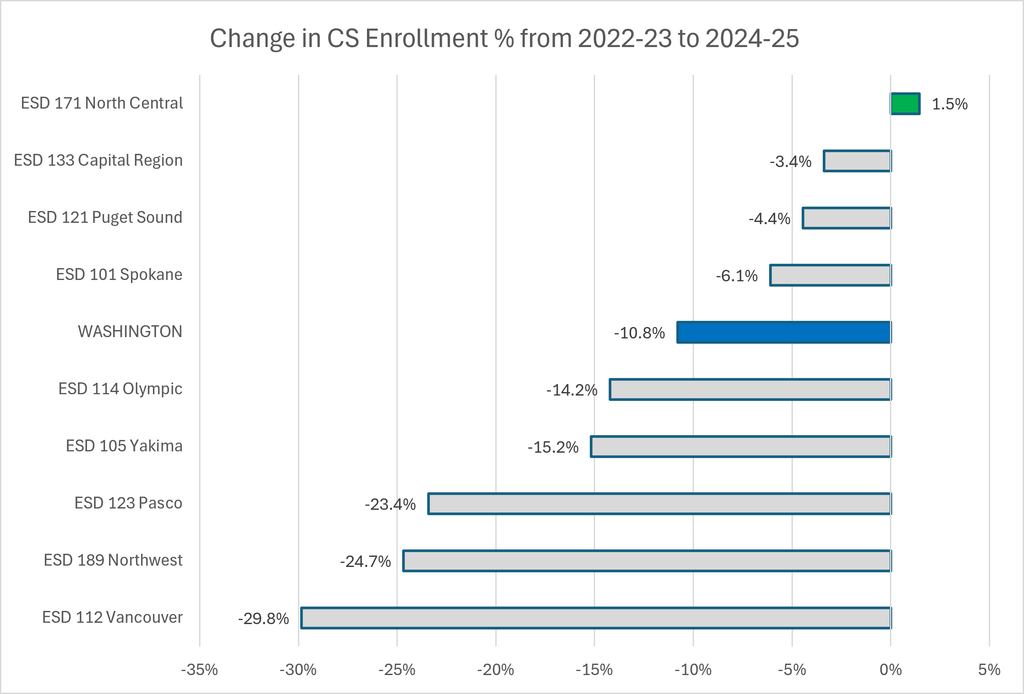
However, the table below and the chart at the top of the article shows that the different regions (ESD) of Washington experienced the decline in computer science participation over the past two years very differently.
|
ESD |
Change % of Schools Offering CS |
Change % of Students Offered CS |
Change % of Students Enrolled in CS in Schools with CS |
Change % of Students Enrolled in CS |
|---|---|---|---|---|
|
ESD 101 Spokane |
12.7% |
0.6% |
-6.6% |
-6.1% |
|
ESD 105 Yakima |
-4.5% |
-1.9% |
-13.5% |
-15.2% |
|
ESD 112 Vancouver |
-15.6% |
-16.2% |
-16.3% |
-29.8% |
|
ESD 114 Olympic |
16.0% |
4.6% |
-18.0% |
-14.2% |
|
ESD 121 Puget Sound |
10.0% |
4.8% |
-8.8% |
-4.4% |
|
ESD 123 Pasco |
4.2% |
-2.5% |
-21.4% |
-23.4% |
|
ESD 133 Capital Region |
1.4% |
3.4% |
-6.6% |
-3.4% |
|
ESD 171 North Central |
-15.3% |
-11.9% |
15.1% |
1.5% |
|
ESD 189 Northwest |
-10.0% |
-9.5% |
-16.7% |
-24.7% |
|
WASHINGTON |
1.8% |
-1.2% |
-10.4% |
-10.8% |
Values better that 5% of Washington state average are highlighted in green. Values worse than 5% of Washington state average are highlighted in red.
The columns in this table are as follows:
- % Schools Offering CS (A): The number of schools offering a CS course / total number of schools. A school is considered to “offer CS” if they have at least one student enrolled in a CS course. Any school with at least one grade 6-12 is included in the total number of schools.
- % of Students Offered CS (B): The number of students in schools that offer CS / total number of students. Only grades 6-12 are considered. This is a measure of the “supply” of students who could take a CS course.
- % of Students Enrolled in CS in Schools with CS (C): The number of students enrolled in CS / total number of students in schools that offer CS. This is a measure of the “demand” of students for CS courses.
- % of Students Enrolled in CS (D): The number of students enrolled in CS / total number of students
The change for each of these columns is 1 – (2024-25 metric) / (2022-23 metric). For Washington, the calculation is as follows:
|
2022-23 Metric |
2024-25 Metric |
% Change |
|
|---|---|---|---|
|
% of Schools Offering CS (A) |
44.7% |
45.5% |
1.8% |
|
% of Students Offered CS (B) |
74.8% |
73.9% |
-1.2% |
|
% of Students Enrolled in CS in Schools with CS (C) |
12.5% |
11.2% |
-10.4% |
|
% of Students Enrolled in CS (D) |
9.3% |
8.3% |
-10.8% |
Interpretation for Each ESD
|
ESD 101 Spokane |
Substantially increased A (12.7%); however, the increase came with small schools so B (0.6%) only showed small gains. Overall decline in D (-6.1%) much better than state metric. |
|
ESD 105 Yakima |
Worse than state metric in B and C lead to a worse than state metric decline in D (-15.2%) |
|
ESD 112 Vancouver |
Significantly worse than state metric in B AND C lead to a overall decline in D (-29.8%) 2.8 times worse than the state metric. |
|
ESD 114 Olympic |
Substantially increased A (16.0%) and B (4.6%), but had significant decline in C (-18.0%) |
|
ESD 121 Puget Sound |
Substantial increase in A (10.0%) and B (4.8%) lead to decline in D (-4.4%) much better than statewide metric. Because ESD 121 is by far the largest ESD by student population (approximately 38%), state values would be much worse without ESD 121 |
|
ESD 123 Pasco |
A significant decrease in C (-21.4%) leads to a decrease in D (-23.4%) 2.2 times worse than the state metric. |
|
ESD 133 Capital Region |
A slight increase in B (3.4%) and a better than state metric decrease in C (-6.6%) leads to a decrease in D (-3.4%) substantially better than state metric. |
|
ESD 171 North Central |
Despite a substantial decrease in A (-15.3%) and B (-11.9%), the growth in C (15.1%) leads to the only ESD with positive D (1.5%) |
|
ESD 189 Northwest |
Significantly worse than state metric in B AND C lead to a overall decline in D (-24.7%) 2.3 times worse than the state metric. |
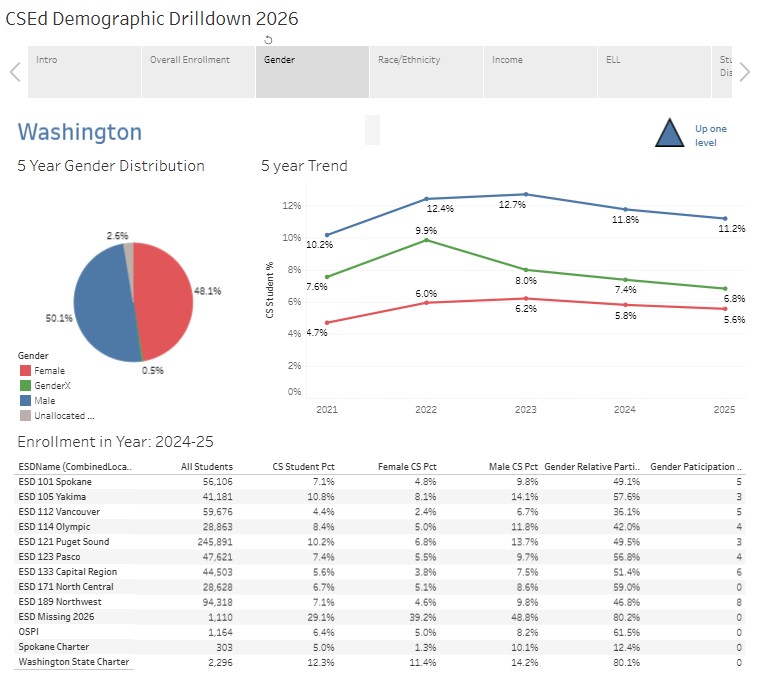
For more ESD level data similar to this, please see Washington CSEd Demographic Drilldown 2026