Washington CTE Growth and Demographics 2026 Beta
This Tableau visualization explores CTE (Career and Technical Education) growth and distribution in Washington from SY 2019-20 to SY 2024-25 from the perspective of overall enrollments, career clusters and CIP codes, gender, race/ethnicity, income, ELL status, and disability status. For each perspective, one can also drill down to see statewide, per ESD, per school district, and per school data.
This Tableau visualization can also be found on Tableau Public (recommended)

WA-ACTE Presentation Materials
Here is the slide deck for the 2026 WA-ACTE Presentation on Aug 4, 2026: Using Data to Improve Your District’s CTE Course Catalog
The following video demonstrates dashboard features. Please contact washington@csteachers.org with any questions.
Background Information
Because CTE courses vary widely in subject matter, enrollments are classified into the 14 Career Clusters specified by the National Career Clusters Framework published in the Fall of 2024. The 14 Career Clusters tracked through this visualization are: Advanced Manufacturing; Agriculture; Arts, Entertainment and Design; Construction; Digital Technology; Education; Energy and Natural Resources; Financial Services; Healthcare and Human Services; Hospitality, Events and Tourism; Management and Entrepreneurship; Marketing and Sales; Public Service & Safety; Supply Chain and Transportation. The mapping of Washington CIP codes to these career clusters in the About Career Clusters tab in the Overall Story was created by making several editorial decisions and referencing several data sources. Please contact us at washington@csteachers.org if you would like to give feedback on future versions of this mapping.
The new Investigations Story provides analysis on the growth of CTE for each ESD, District, and School; the growth of each Career Cluster and CIP code, and the ability to search for what schools provided sections in what CIP Code in a given year.
The primary data source are two public data requests made to OSPI: one in the summer of 2025 and the other in the spring of 2026.
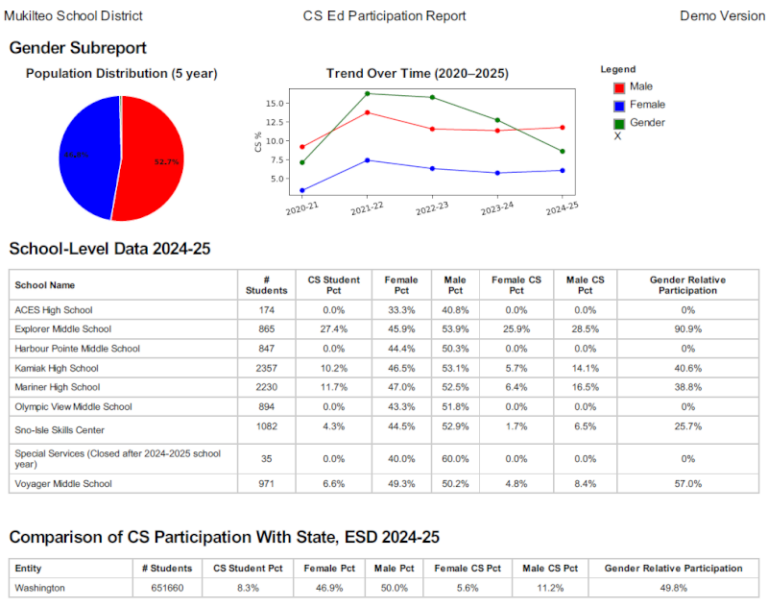
With this and related visualizations and report PDFs, it is hoped that educational leaders at the state, ESD, district, and school level can better understand the strengths and weaknesses and make better decisons regarding CS and CTE education in their organizations.
Beta Version
The data presented in this Tableau visualization is complete and accurate to the best of our knowledge. However, this visualization is not final and should be considered a beta version for feedback. If you have any feedback or would like to sponsor further development of this and other Tableau visualizations and PDF reports on CTE and CS Education in Washington, please contact us at washington@csteachers.org