CTE Enrollment Demographic Variation in Washington 2023-24
This article reports on the distribution of CTE (Career and Technical Education) enrollments across the 14 career clusters and how this distribution varied across demographic groups in Washington state in SY2023-24.
While the Washington CTE Demographic Drilldown 2023-24 dashboard shows how CTE enrollments are distributed among the fourteen clusters on the state, ESD, district, and school level for different demographic groups in the right-most column of the dashboards, understanding how these distributions differ from each other is difficult from the dashboard alone. This blog post addresses this issue by reporting on how CTE enrollments in the fourteen career clusters differ among demographic groups at the Washington state level. Educators can then use the insights provided by this report to give them the context to better understand the distribution of their CTE enrollments in their individual organizations.
Statewide Distribution of CTE Enrollments by Career Cluster 2023-24
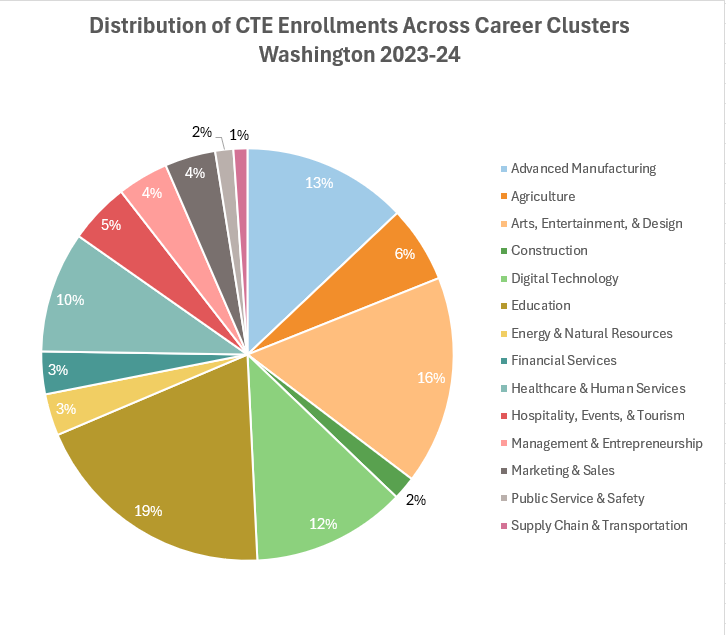
The baseline distribution for calculating the variance in CTE Enrollments by Career Cluster in 2023-24 among various demographic groups is the Washington statewide distribution for 2023-24:
|
Career Cluster |
% of Statewide CTE Enrollments 2023-24 |
|---|---|
|
Advanced Manufacturing |
13.0% |
|
Agriculture |
6.0% |
|
Arts, Entertainment, & Design |
16.4% |
|
Construction |
1.8% |
|
Digital Technology |
12.1% |
|
Education |
19.4% |
|
Energy & Natural Resources |
3.3% |
|
Financial Services |
3.3% |
|
Healthcare & Human Services |
9.5% |
|
Hospitality, Events, & Tourism |
4.8% |
|
Management & Entrepreneurship |
4.0% |
|
Marketing & Sales |
4.0% |
|
Public Service & Safety |
1.4% |
|
TOTAL |
100.0% |
The Career Clusters are the fourteen listed in the National Career Clusters Framework published by Advance CTE in the fall of 2024. To see what CIP Codes/Courses belong to each career cluster, see the CIP Code to Career Cluster Mapping tab on the Washington CTE Enrollments by Career Cluster 2023-24 dashboard or view the CIP Code Growth Rates by Total CTE Enrollments table on the CTE Enrollment Growth By CIP Code 2019-2024
Heterogeneity and Total Variation Difference (TVD)
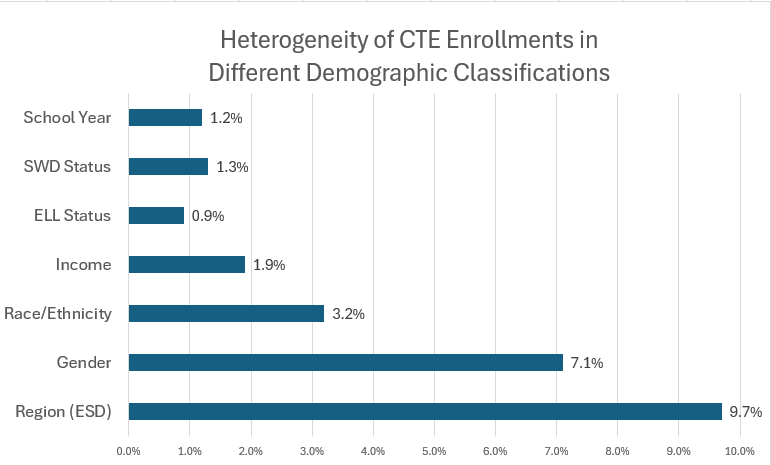
With the statewide distribution for 2023-24 as a baseline, the heterogeneity for various demographic groups in Washington state is as follows:
|
Demographic Classification |
Heterogeneity |
|---|---|
|
Region (ESD) |
9.7% |
|
Gender |
7.1% |
|
Race/Ethnicity |
3.2% |
|
Income |
1.9% |
|
ELL Status |
0.9% |
|
SWD Status |
1.3% |
|
School Year |
1.2% |
Heterogeneity in this article is the measure of how much the distribution of CTE Enrollments across the different career clusters differs across the demographic groups in that classification. In Washington, heterogeneity in career cluster enrollments is highest by region/ESD (9.7%) followed by gender (7.1%) in 2023=24. Heterogeneity in all other demographic classifications is relatively small by comparison
For each demographic classification, in addition to restating the homogeneity of the entire demographic classification, for each demographic group, the following data points are provided:
- The TVD (Total Variation Distance) of the distribution of CTE enrollments across career clusters compared to the baseline distribution (Washington state 2023-24).
- The Career Cluster with the maximum positive difference to the baseline distribution and the percentage by which it differs. This is the Career Cluster with the most CTE enrollments compared to expected state averages.
- The Career Cluster with the maximum negative difference to the baseline distribution and the percentage by which it differs. This is the Career Cluster with the least CTE enrollments compared to expected state averages.
Total Variation Distance (TVD) in this article is a measure of the difference between the distribution of CTE enrollments across career clusters and the baseline distribution, interpreted as the percentage of enrollments that would need to change career clusters for the distributions to match. Heterogeneity in a demographic classification is the weighted average of the Total Variation Distance of all of the demographic groups defined in that classification.
When looking at Career Clusters with the maximum positive and negative differences within a demographic, it is important to recognize that the same percentage difference can have very different effects depending on the Career Cluster. A 3.0% difference in Agriculture with a baseline percentage of 6.0% is much more dramatic than a 3% difference in Education with a baseline percentage of 19.4%.
Variation by Region (ESD)
Heterogeneity: 9.7%
|
ESD |
TVD |
Max Positive Difference |
Max Negative Difference |
|---|---|---|---|
|
ESD 101 Spokane |
18.6% |
Advanced Manufacturing (10.7%) |
Education (-9.3%) |
|
ESD 105 Yakima |
9.8% |
Agriculture (2.8%) |
Arts, Entertainment, & Design (-6.0%) |
|
ESD 112 Vancouver |
11.3% |
Education (4.2%) |
Digital Technology (-4.6%) |
|
ESD 114 Olympic |
9.0% |
Healthcare & Human Services (3.6%) |
Agriculture (-2.6%) |
|
ESD 121 Puget Sound |
6.5% |
Arts, Entertainment, & Design (4.2%) |
Agriculture (-3.5%) |
|
ESD 123 Pasco |
12.3% |
Agriculture (3.7%) |
Energy & Natural Resources (-3.1%) |
|
ESD 133 Capital Region |
15.5% |
Agriculture (3.9%) |
Education (-6.8%) |
|
ESD 171 North Central |
15.2% |
Agriculture (8.5%) |
Arts, Entertainment, & Design (-6.0%) |
Variation by Gender
Heterogeneity: 7.1%
|
Gender |
TVD |
Max Positive Difference |
Max Negative Difference |
|---|---|---|---|
|
Female |
7.7% |
Education (3.1%) |
Advanced Manufacturing (-3.7%) |
|
Gender X |
11.7% |
Arts, Entertainment, & Design (5.8%) |
Advanced Manufacturing (-5.5%) |
|
Male |
6.5% |
Advanced Manufacturing (3.1%) |
Education (-2.6%) |
Variation by Race/Ethnicity
Heterogeneity: 3.2%
|
Race/Ethnicity |
TVD |
Max Positive Difference |
Max Negative Difference |
|---|---|---|---|
|
Asian |
8.6% |
Digital Technology (4.5%) |
Agriculture (-4.1%) |
|
Black |
8.6% |
Arts, Entertainment, & Design (2.9%) |
Agriculture (-3.2%) |
|
Hawaiian/Pacific Islander |
5.9% |
Arts, Entertainment, & Design (1.8%) |
Agriculture (-2.4%) |
|
Hispanic/LatinX |
2.5% |
Agriculture (1.4%) |
Advanced Manufacturing (-0.8%) |
|
Native American |
7.8% |
Agriculture (2.5%) |
Arts, Entertainment, & Design (-1.9%) |
|
Two or More |
3.7% |
Arts, Entertainment, & Design (1.8%) |
Agriculture (-2.0%) |
|
White |
2.0% |
Advanced Manufacturing (0.9%) |
Arts, Entertainment, & Design (-0.6%) |
Variation by Income Status
Heterogeneity: 1.9%
|
Income Status |
TVD |
Max Positive Difference |
Max Negative Difference |
|---|---|---|---|
|
Low-Income |
1.9% |
Agriculture (0.8%) |
Arts, Entertainment, & Design (-0.4%) |
|
Not Low-Income |
1.9% |
Arts, Entertainment, & Design (0.4%) |
Agriculture (-0.8%) |
Variation by ELL Status
Heterogeneity: 0.9%
|
ELL Status |
TVD |
Max Positive Difference |
Max Negative Difference |
|---|---|---|---|
|
ELL |
2.7% |
Arts, Entertainment, & Design (1.2%) |
Management & Entrepreneurship (-0.7%) |
|
Not ELL |
0.5% |
Management & Entrepreneurship (0.1%) |
Arts, Entertainment, & Design (-0.2%) |
Variation by Disability Status
Heterogeneity: 1.3%
|
Disability Status |
TVD |
Max Positive Difference |
Max Negative Difference |
|---|---|---|---|
|
SWD |
5.1% |
Agriculture (1.7%) |
Healthcare & Human Services (-1.6%) |
|
Not SWD |
0.7% |
Healthcare & Human Services (0.2%) |
Agriculture (-0.2%) |
Variation by School Year 2019-2024
Heterogeneity: 1.2%
|
School Year |
TVD |
Max Positive Difference |
Max Negative Difference |
|---|---|---|---|
|
2019-20 |
1.5% |
Digital Technology (0.8%) |
Hospitality, Events, & Tourism (-0.4%) |
|
2020-21 |
1.5% |
Digital Technology (0.6%) |
Management & Entrepreneurship (-0.4%) |
|
2021-22 |
0.7% |
Digital Technology (0.2%) |
Arts, Entertainment, & Design (-0.2%) |
|
2022-23 |
0.9% |
Management & Entrepreneurship (0.3%) |
Digital Technology (-0.4%) |
|
2023-24 |
1.4% |
Management & Entrepreneurship (0.3%) |
Digital Technology (-1.1%) |