Washington CS and CTE Education Analytics 2025
This post contains summaries of the following posts on data dashboards on Washington CS and CTE Education during the period of 2019-2024:
- Washington CS Education Enrollments 2019-24
- Washington CS Teacher Population 2019-24
- Washington Computer Science Courses 2019-24
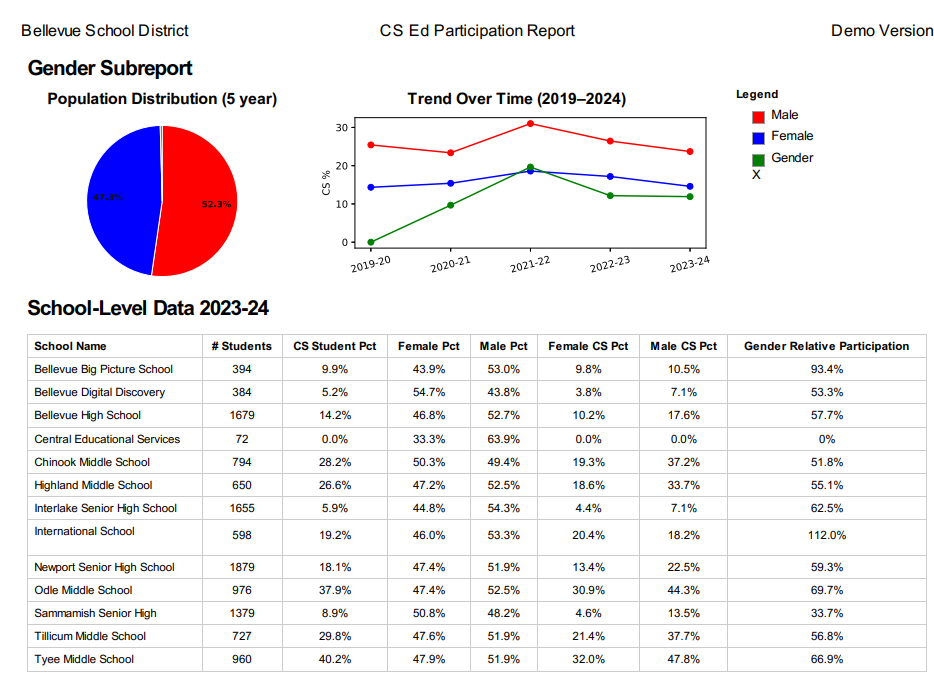
- CS Education in Washington Demographic Drilldown 2019-24
- Washington CS Education PDF District Reports 2019-24
- Washington CTE Enrollments by Career Clusters 2019-24
- Washington CTE Demographic Drilldown 2019-24
Washington educators and education administrators should also review the following posts for guidance on interpreting the information about their organization in these dashboard and reports:
- KPI for CS Education in Washington 2023-24 and related posts (CSEd Availability KPI Washington 2023-24, CSEd Participation KPI Washington 2023-24, CSEd Relative Participation KPI Washington 2023-24)
- CS Course Growth Rates in Washington 2019-2024
- Top Schools and Districts for CSEd 2023-24
- Top Schools and Districts for Girls in CSEd 2023-24
Please help CSTA Washington continue this effort and reach educators, district leaders, and policymakers with these tools so they can make smarter decisions and help all students learn basic computer science principles. Donate here
Every year OSPI (Washington Office of Superintendent of Public Instruction) publishes a Computer Science Education Data Summary Report per HB 1577 (2019). The current version for 2023-24 covers school years 2019-20 through 2023-24.
While this report contains a wealth of data, there is only one chart showing the percentage of schools in Washington with at least one student enrolled in a computer science courses. There is no analysis of the data providing key takeaways, and the series of data grids is difficult for ESDs, school districts, and individual schools to make use of.
The blog posts linked to this one aim to
- Enable readers to visualize the wealth of data in the Computer Science Education Data Summary Report
- Make it easier for ESDs, school districts, and individual schools and teachers to utilize this data to improve computer science education in organizations
- Offer some simple analysis and key takeaways from the data
In addition, the blog posts linked to this one also provide similar capability on CTE (Career and Technical Education) in Washington as a substantial majority of CS courses in Washington are taught as CTE
While the linked blog posts, Tableau visualizations, and PDF reports are feature- and data-complete and accurate to the best of our knowledge, they should be considered demo or beta versions as of 12/1/2025. CSTA Washington wants your feedback on how these can be improved for the final 2025 version and for future year versions. CSTA Washington is also hoping to find sponsors who would be willing to help fund the development of the final 2025 versions and those of future years. If you would like to provide feedback on these demo versions or would like to sponsor (or donate to) the development of future versions, please contact washington@csteachers.org.
Washington CS Education Enrollments 2019-24
Washington CS Education Enrollments 2019-24 and its corresponding visualizations illustrate the changes in CS education enrollments in Washington’s public schools from 2019 to 2024. The blog post hosts two Tableau visualizations: Washington CSEd Enrollments 2019-24 and Washington CSEd Demographics 2019-24.
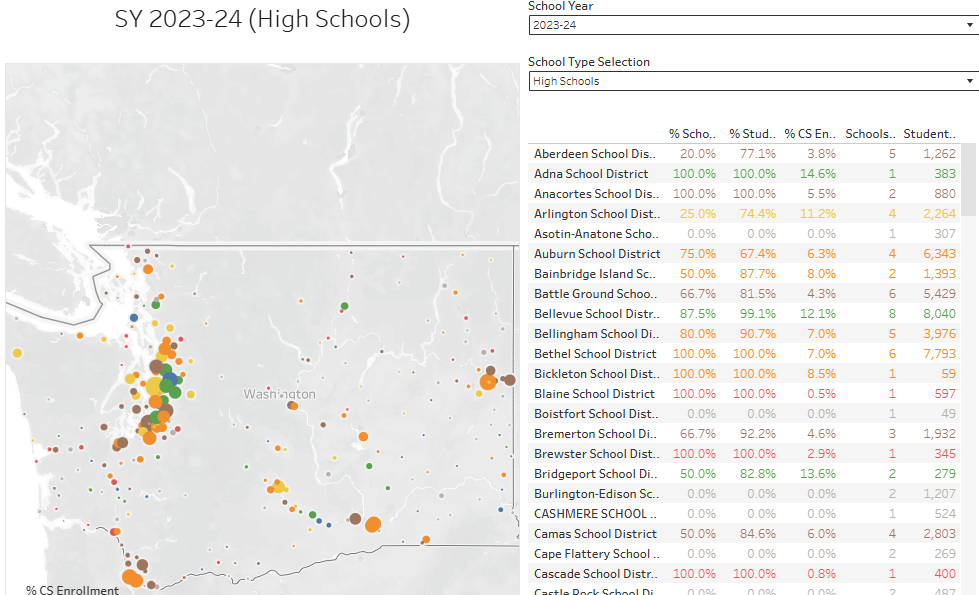
Washington CSEd Enrollments 2019-24 provides visualizations of the percentage of schools offering CS, the percentage of students offered CS, and the percentage of students enrolled in CS from 2019 to 2024. Drilldowns into this data are available statewide, by ESD, by school district, by school, and by school type.
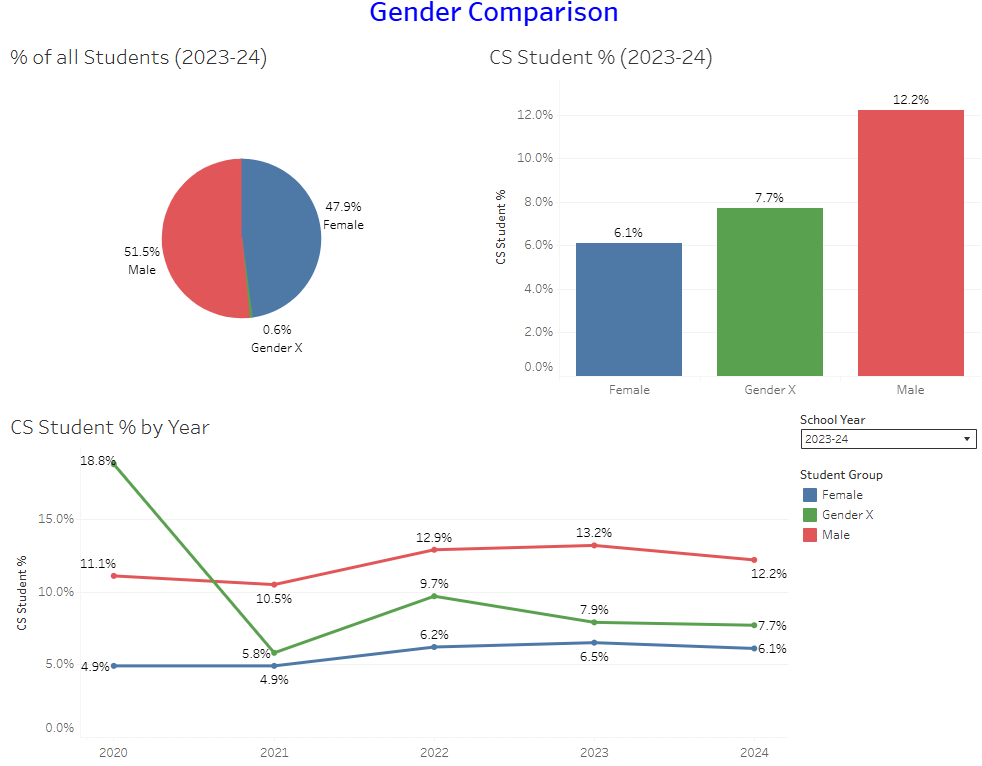
Washington CSEd Demographics 2019-2024 provides visualizations of how the percentage of students enrolled in CS changed statewide in various demographic groups from 2019-20. Drilldowns into this data are available by gender, by race/ethnicity, by income, by grade level, by English Language Learner status, and by disability status
Washington CS Teacher Population 2019-24
Washington CS Teacher Population 2019-24, and its Tableau visualizations, illustrate the changes in the distribution of educators teaching CS courses in Washington’s public schools from 2019 to 2024. The blog post features two Tableau visualizations: CS Teachers in Washington 2019-24 and CS Teacher Demographics in Washington 2019-24.
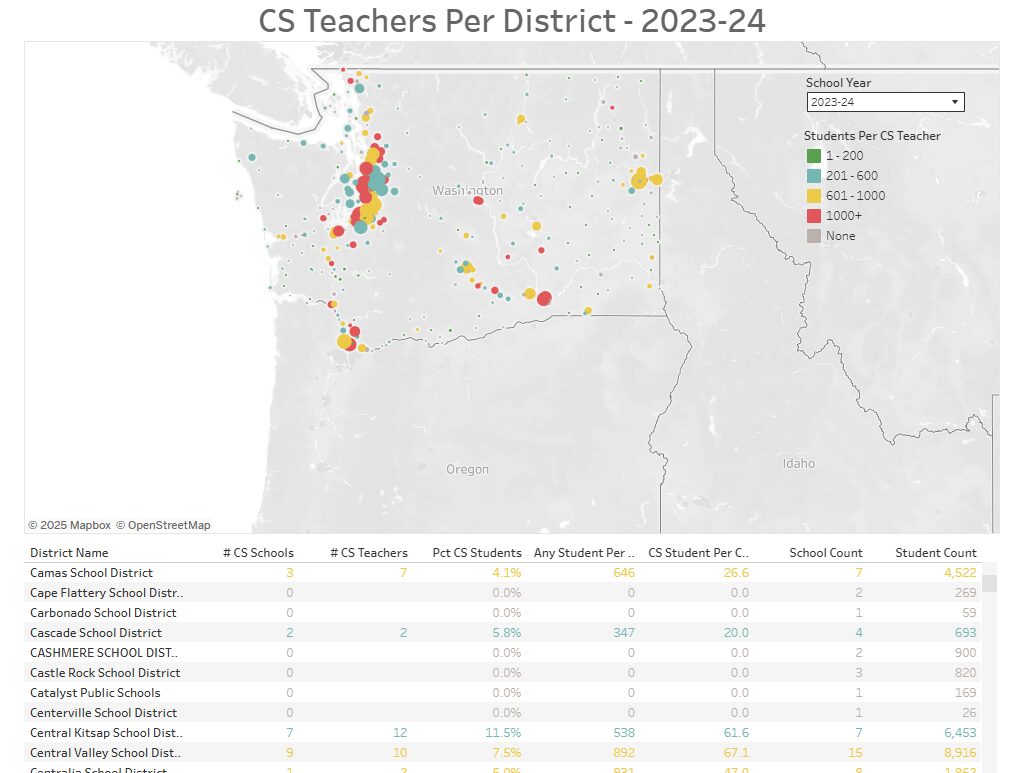
CS Teachers in Washington 2019-24 illustrates how the number of CS teachers, total students per CS teacher, and CS students per CS teacher changed from 2019 through 2024. Drilldowns are available statewide, per ESD, and per school.
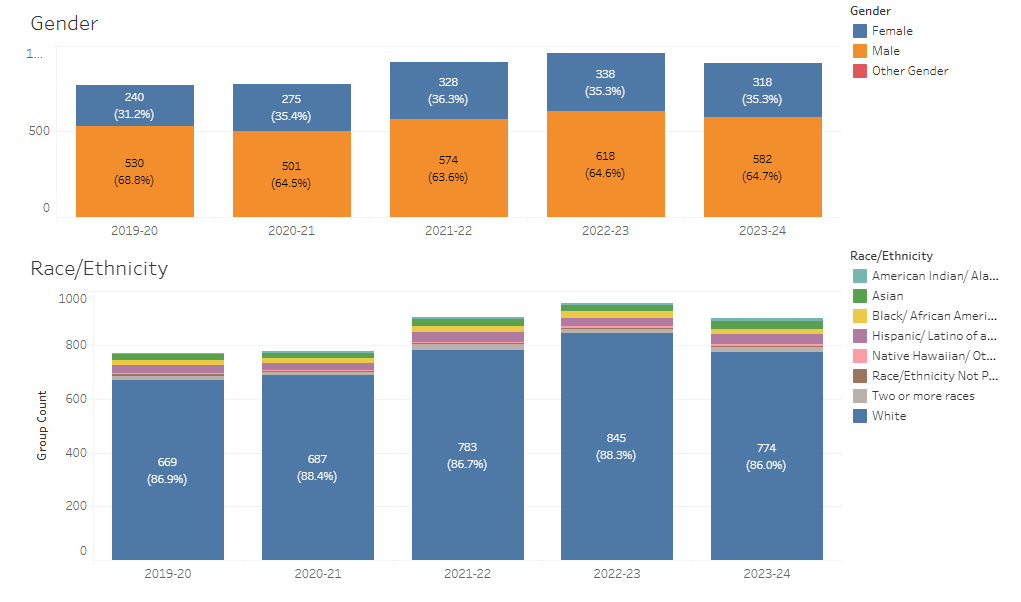
CS Teacher Demographics in Washington 2019-24 shows how the demographics of CS teachers in Washington changed from 2019-24. Breakdowns are available by gender, by race/ethnicity, by degree/experience, and by certification/in field status.
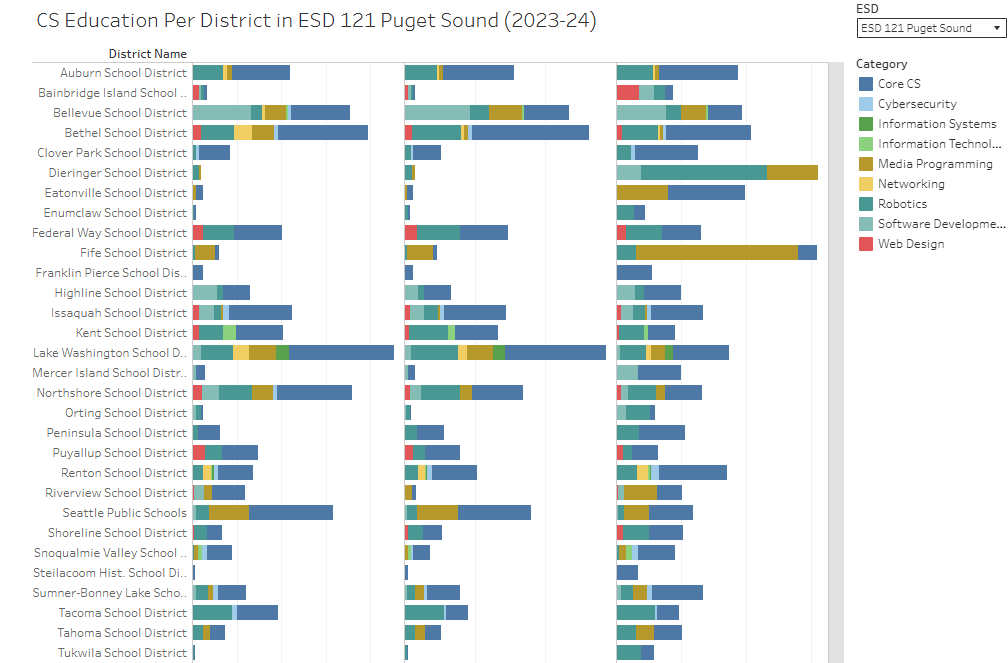
Washington Computer Science Courses 2019-24
Washington Computer Science Courses 2019-24 and its Tableau visualization illustrates what types of computer science courses (with an approximation the number of students taught) were taught in Washington’s public schools from 2019-24. Course categorizations include Core CS, Cybersecurity, Data Science, Databases, Information Systems, Information Technology, Media Programming, Networking, Robotics, Software Development, and Web Page Design. Drilldowns are available statewide, by ESD, and by district. The visualization also provides an analysis of what percentage of CS courses are taught as CTE.
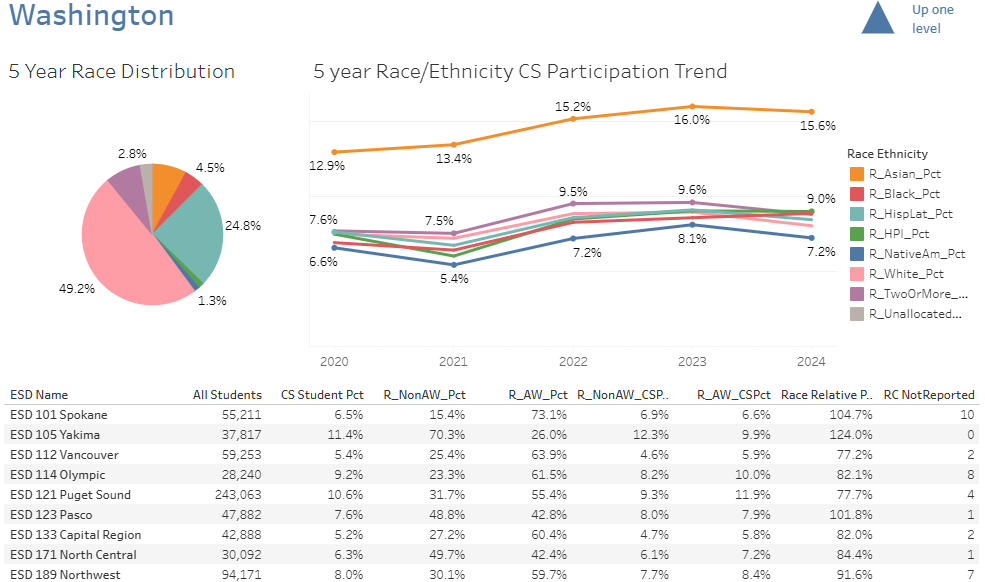
CS Education in Washington Demographic Drilldown 2019-24 and its Tableau visualization combine the elements of the visualizations in Washington CS Education Enrollments 2019-24 into a single visualization. Using the drilldown visualization, one can view how overall CS enrollment, CS enrollment by gender, CS enrollment by race/ethnicity, CS enrollment by income level, CS enrollment by ELL status, by disability status, and by grade level changed statewide, per ESD, per district, and per school.
Washington CS Education PDF District Reports 2019-24
The Washington CS Education PDF District Reports 2019-24 provides a summary of the data in the CS Education in Washington Demographic Drilldown above for each school district in Washington in PDF format. For each district, one can view how CS education enrollment changed overall and by gender, income level, ELL status, disability status, and grade level for each school in the district from 2019 to 2024. As the Tableau visualizations are designed top-down, these PDF reports make it easier for members of the individual school districts and schools to distribute and discuss CS education data at a local level.
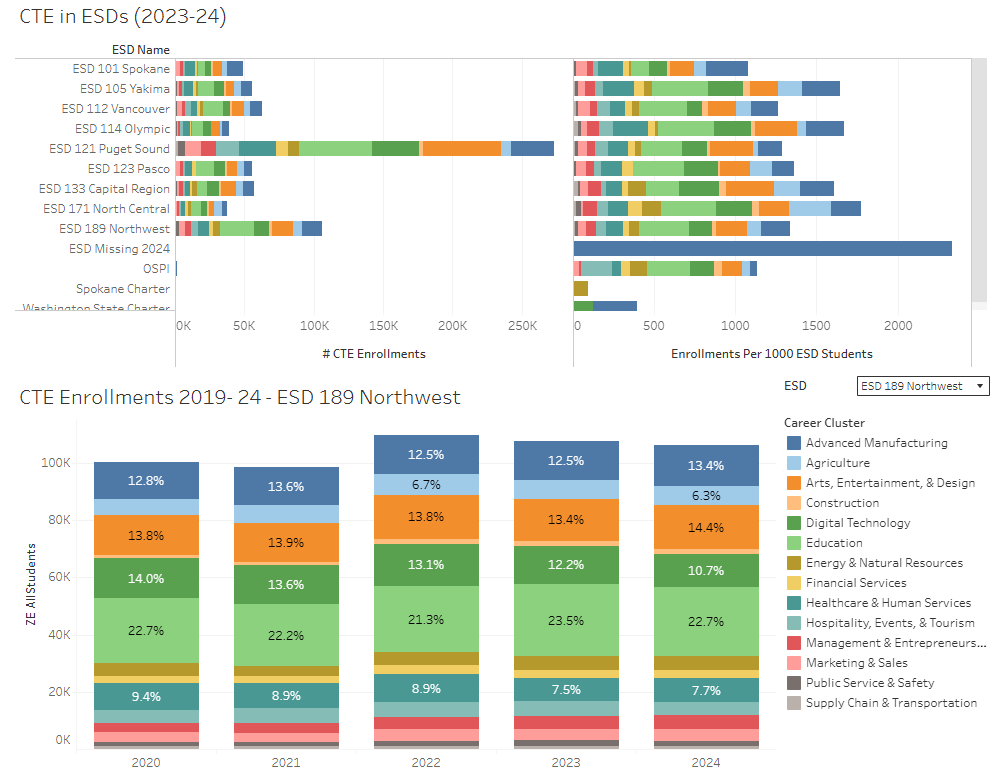
Washington CTE Enrollments by Career Clusters 2019-24
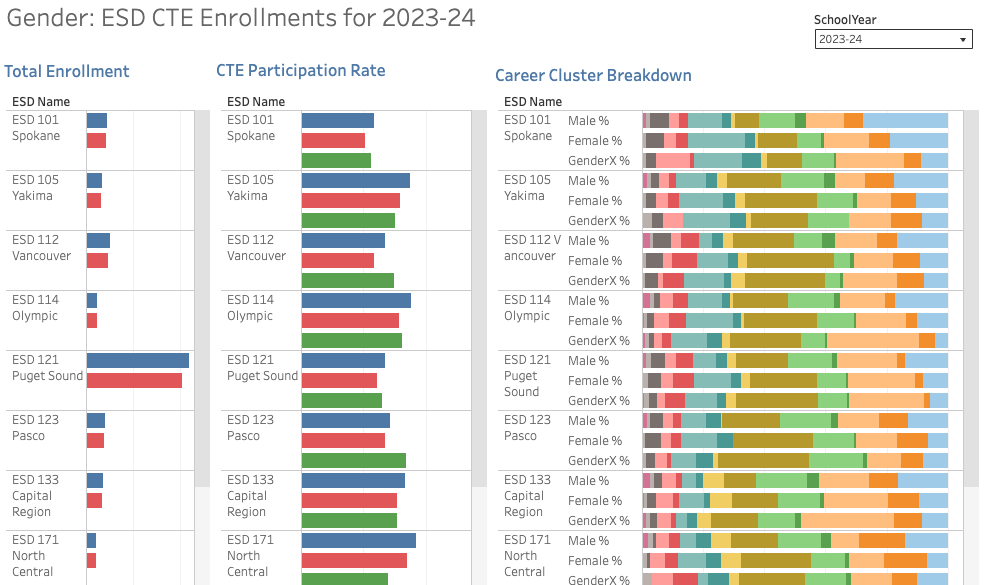
Washington CTE Enrollments by Career Clusters 2019-24 and its Tableau visualization illustrate how many students enrolled in what type of CTE (Career and Technical Education) courses in Washington’s public schools from 2019 to 2024. The Career Clusters are the 14 listed in the National Career Clusters Framework published by Advance CTE in the fall of 2024. Drilldowns are available statewide, by ESD, by school district, and by school.
Washington CTE Demographic Drilldown 2019-24
Washington CTE Demographic Drilldown 2019-24 and its Tableau visualization one can view how how CTE education enrollment changed overall and by gender, income level, ELL status, and disability status statewide, per ESD, per district, and per school. Further, enrollment is broken down into the 14 national Career Clusters to better understand how the distribution of CTE education changes in each demographic group.