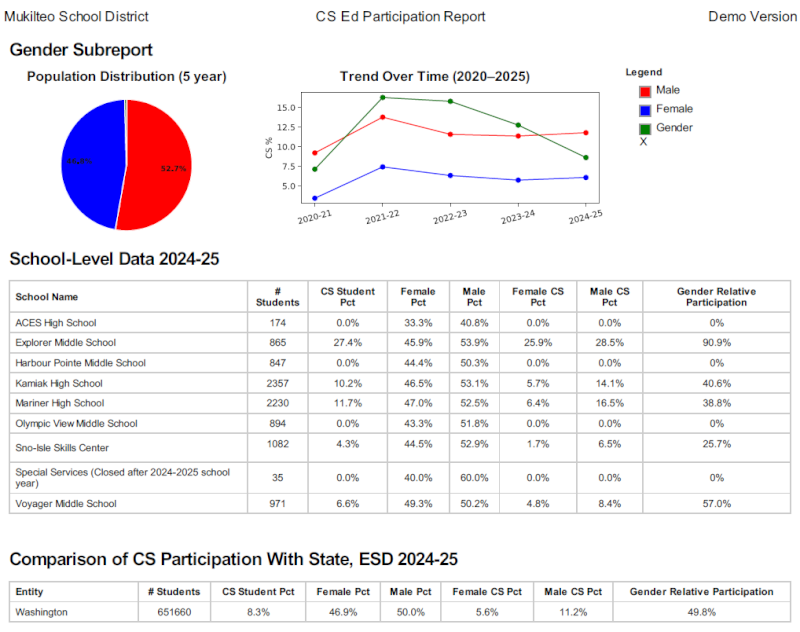
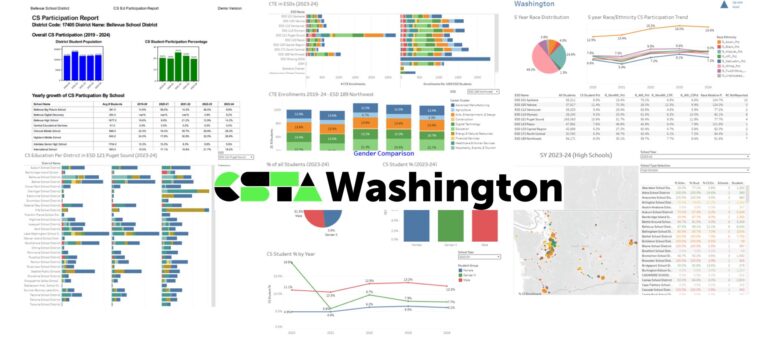
Using the drop-down box below, school districts can retrieve data from the Tableau visualization in Washington CSEd Demographic Drilldown 2026 for their district in PDF format. Each PDF contains data on how CS education enrollment changed overall and by gender, income level, ELL status, disability status, and grade level for each school in the district from 2020 to 2025. As the Tableau visualizations are designed top-down, these PDF reports make it easier for members of the individual school districts and schools to distribute and discuss CS education data at a local level.
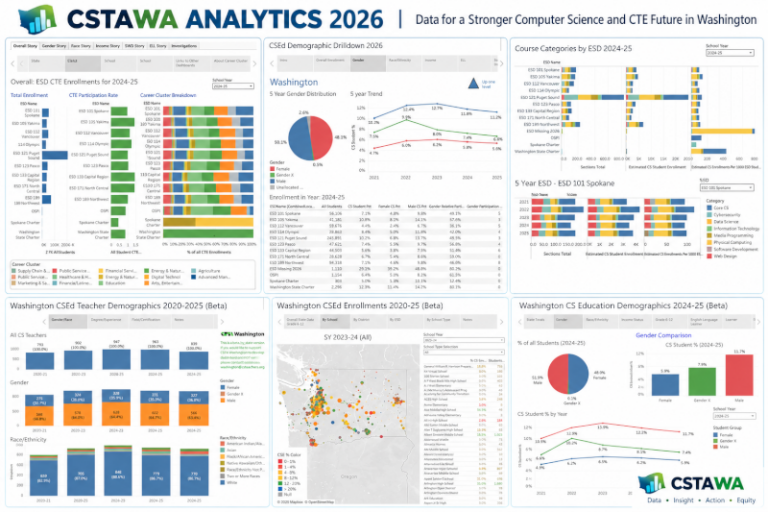
With this and related visualizations and report PDFs, it is hoped that educational leaders at the state, ESD, district, and school level can better understand the strengths and weaknesses and make better decisions regarding CS and CTE education in their organizations. For a full list of all related visualizations and PDFs currently available, please visit Washington CS Education and CTE Analytics 2026.
The data presented in these PDFs are complete and accurate to the best of our knowledge. However, they are not final and should be considered beta versions to elicit feedback. If you have any feedback or would like to sponsor further development of this and other Tableau Dashboards on CTE and CS Education in Washington, please contact us at washington@csteachers.org.
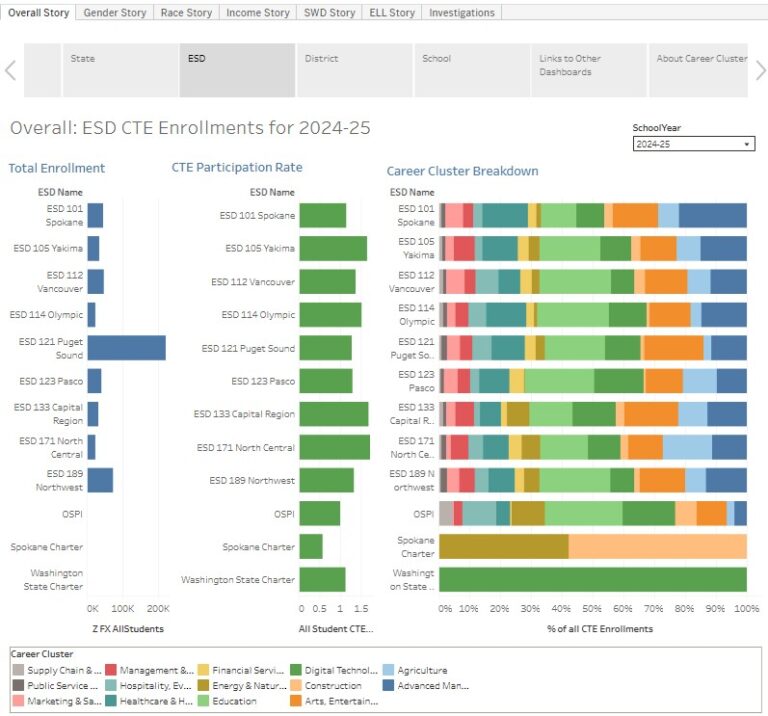
This Tableau visualization explores CTE (Career and Technical Education) growth and distribution in Washington from SY 2019-20 to SY 2024-25 from the perspective of overall enrollments, career clusters and CIP codes, gender, race/ethnicity, income, ELL status, and disability status. For each perspective, one can also drill down to see statewide, per ESD, per school district, and…
This post contains summaries of the following posts on data dashboards on Washington CS Education and CTE Education during the period of 2019-2025: Please help CSTA Washington continue this effort and reach educators, district leaders, and policymakers with these tools so they can make smarter decisions and help all students learn basic computer science principles. Donate…
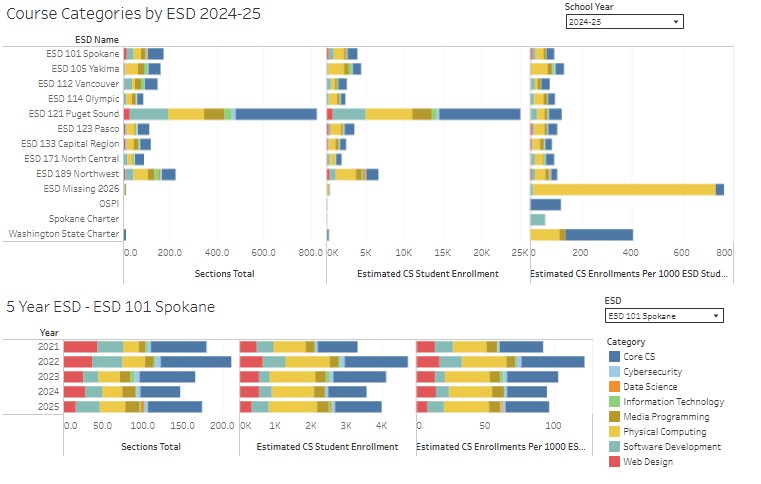
This Tableau visualization illustrates what types of computer science courses (with an approximation the number of students) were taught in Washington’s public schools from SY 2020-21 to SY 2024-25. Course categorizations include Core CS, Cybersecurity, Data Science, Information Technology, Media Programming, Physical Computing, Software Development, and Web Page Design. Drilldowns are available statewide, by ESD, and…
This post contains summaries of the following posts on data dashboards on Washington CS and CTE Education during the period of 2019-2024: The code and data for all of these dashboards may be found on a public repository on Github. A videocast of how to use the CS Education dashboards and reports may be found…
Computer Science Education and Career and Technical Education (CTE) have a close and mutually reinforcing relationship in Washington state. More than 85% of computer science course sections — and an even higher percentage of student enrollments — are offered through CTE programs. In addition, Digital Technology is not only recognized as its own career cluster…
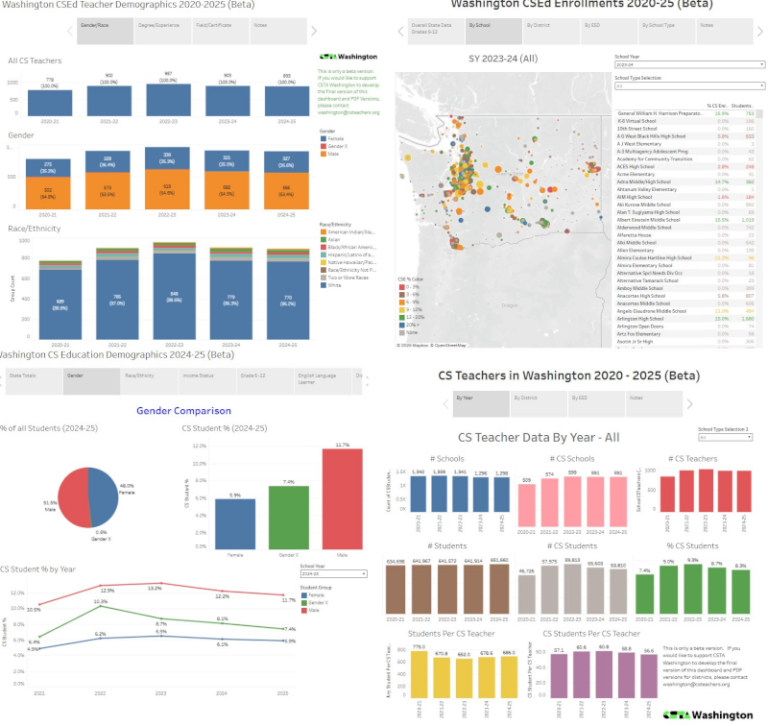
This Tableau visualization explores computer science student enrollments and the computer science teacher population for grades 6 – 12 in Washington for SY 2020-21 to SY 2024-25. This dashboard primarily uses data from the Computer Science Education Data Summary Report, which OSPI publishes yearly under HB 1577 (2019). The current version released in June 2026…