2026 PK-12 CS Standards: Foundation and Specialty Learning
The new CS standards answer two separate questions: What computer science should every student learn What should students learn when they choose to pursue computer science more deeply?

CSTA Washington
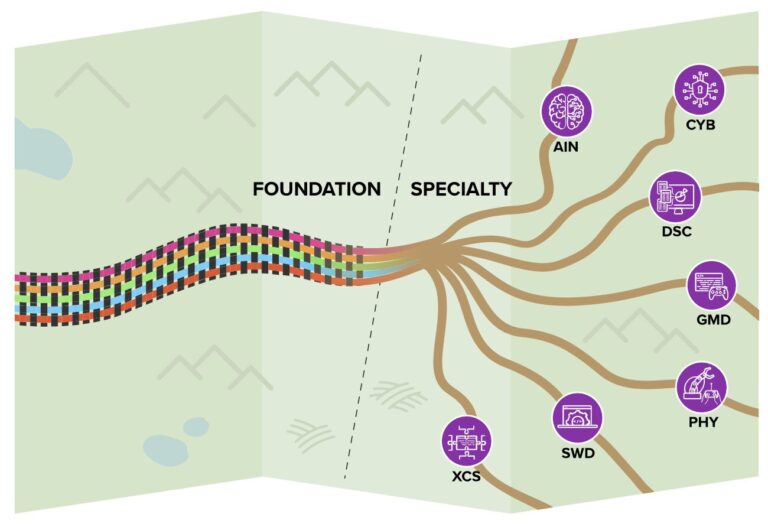
The new CS standards answer two separate questions: What computer science should every student learn What should students learn when they choose to pursue computer science more deeply?
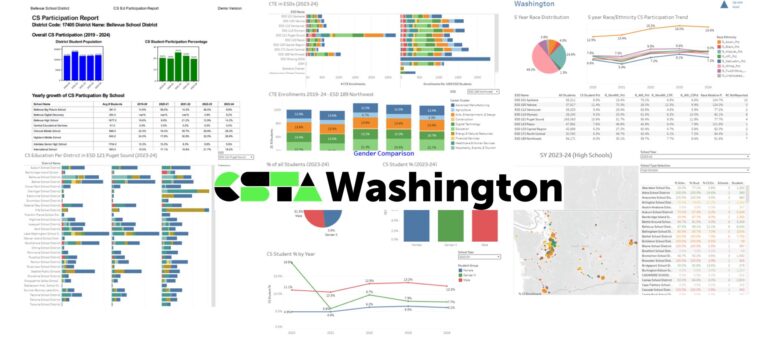
This post contains summaries of the following posts on data dashboards on Washington CS and CTE Education during the period of 2019-2024: The code and data for all of these dashboards may be found on a public repository on Github. A videocast of how to use the CS Education dashboards and reports may be found…
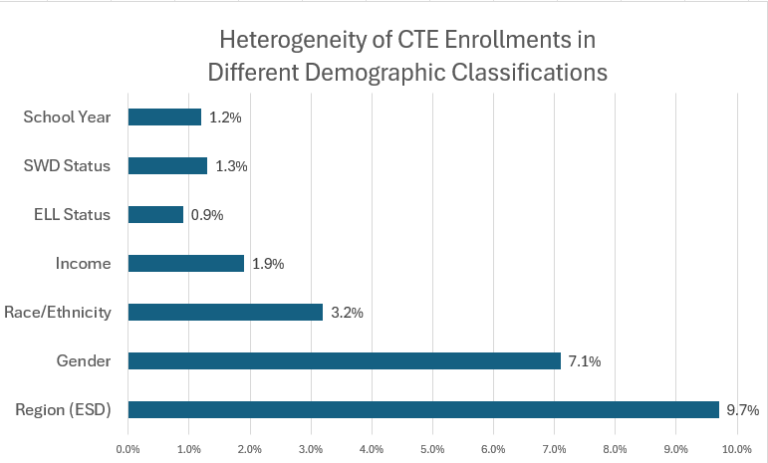
A report on the distribution of CTE (Career and Technical Education) enrollments across the 14 career clusters and how this distribution varied across demographic groups in Washington state in SY2023-24.
Education administrators, teachers, and advocates should use the following CS Education relative performance KPI (key performance indicators) (KPI) in the dashboards and reports in Washington CS and CTE Education Analytics 2023-24 to compare the state of computer science education in ESDs, districts, and schools in Washington of varying sizes and demographics: Relative Participation KPI are equity measures…
Education administrators, teachers, and advocates should use the following two CS Education participation key performance indicators (KPI) in the dashboards and reports in Washington CS and CTE Education Analytics 2023-24 to compare the state of computer science education in ESDs, districts, and schools in Washington of varying sizes and demographics: These KPI measure the percentage of students…
Education administrators, teachers, and advocates should use the following CS Education availability key performance indicators (KPI) in the dashboards and reports in Washington CS and CTE Education Analytics 2023-24 to compare the state of computer science education in ESDs, districts, and schools in Washington of varying sizes and demographics: Availability KPI (key performance indicators) measure…
Using the drop-down box below, school districts can retrieve data from the Tableau visualization in CS Education in Washington Demographic Drilldown for their district in PDF format. Each PDF contains data on how CS education enrollment changed overall and by gender, income level, ELL status, disability status, and grade level for each school in the district from…
This Tableau visualization combine the elements of the visualizations in Washington CS Education Enrollments 2019-24 into a single visualization. Using the drilldown visualization, one can view how CS enrollment overall, by gender, by race/ethnicity, by income level, by ELL status, by disability status, and by grade level changed statewide, per ESD, per district, and per…
This Tableau visualization illustrates what types of computer science courses (with an approximation the number of students taught) were taught in Washington’s public schools from 2019-24. Course categorizations include Core CS, Cybersecurity, Data Science, Databases, Information Systems, Information Technology, Media Programming, Networking, Robotics, Software Development, and Web Page Design. Drilldowns are available statewide, by ESD,…
The two Tableau visualizations CS Teachers in Washington 2019-24 and CS Teacher Demographics in Washington 2019-24 illustrate the changes in the distribution of educators teaching CS courses in Washington’s public schools from 2019 to 2024. CS Teachers in Washington 2019-24 This visualization can also be found on Tableau Public. CS Teachers in Washington 2019-24 illustrates how the number…